Download
1 / 55
550 likes | 665 Views
Explore the comprehensive enrollment demographics and student performance data for Zionsville Community Schools as of October 2014. This extensive analysis includes five-year enrollment trends at the elementary, middle, and high school levels, detailed grade and gender distribution across all schools, and insights into the district's ethnicity and free/reduced lunch statistics. Additionally, review the historical performance data for ISTEP, SAT, ACT, and Advanced Placement exams, providing a holistic view of student outcomes and educational finance in the district.

E N D
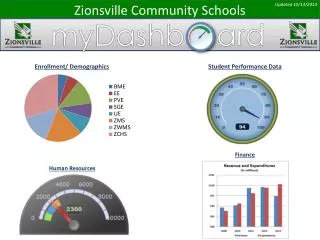
Zionsville Community Schools Updated 10/13/2014 ZCS Enrollment/ Demographics Student Performance Data Finance Human Resources
Enrollment Summary District-Level Data:
District 5-year Enrollment Only Show: Elementary | Middle | High | District
Elem School 5-year Enrollment Only Show: Elementary | Middle | High | District
Middle School 5-year Enrollment Only Show: Elementary | Middle | High | District
ZCHS 5-year Enrollment Only Show: Elementary | Middle | High | District
District Ethnicity Graphs: Current | 5-year
Ethnicity History Graphs: Current | 5-year
District Free and Reduced Lunch Graphs: Current | 5-year
Free/Reduced History Graphs: Current | 5-year
Student Performance Data Select one • ISTEP • SAT • ACT • AP • ECA • Attendance
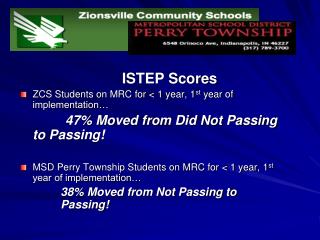
EE ISTEP History School Data: BME | EE | PVE | SGE | UE | ZMS | ZWMS
PVE ISTEP History School Data: BME | EE | PVE | SGE | UE | ZMS | ZWMS
SGE ISTEP History School Data: BME | EE | PVE | SGE | UE | ZMS | ZWMS
UE ISTEP History School Data: BME | EE | PVE | SGE | UE | ZMS | ZWMS
ZMS ISTEP History School Data: BME | EE | PVE | SGE | UE | ZMS | ZWMS
ZWMS ISTEP History School Data: BME | EE | PVE | SGE | UE | ZMS | ZWMS
AP Score Distribution APTest ScoreDistribution
ECA Algebra I ECA Algebra I Results (First-Time Testers)