Download
1 / 9
90 likes | 189 Views
Explore the LSMEANS analysis of Oil A, Oil D, PC10 E, and PC10 G parameters using both original and lab-adjusted data. The study proposes C13 limits and compares various technologies to assess the impact on parameter values.

E N D
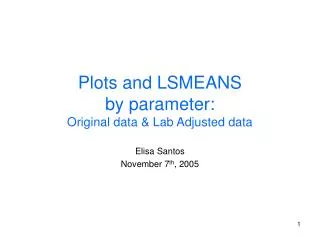
Plots and LSMEANS by parameter: Original data & Lab Adjusted data Elisa Santos November 7th, 2005
LSMEANS by parameter Oil A PC10 E Oil D and PC10 G PC10 D MERIT SCALE Proposed C13 limits
Lab adjusted LSMEANS by parameter Proposed C13 limits
C13 parameters and corresponding summary statistics: Dark green area represents Oil D and PC10 G
Lab Adj. C13 parameters and corresponding summary statistics: Dark green area represents Oil D and PC10 G
Delta OC by Oil: Original and Lab Adjusted Squares represent Technology A X represents Technology B
OTGC 32 tests by Oil: Original and Lab Adjusted Squares represent Technology A X represents Technology B
scrnd TLC by Oil: Original and Lab Adjusted Squares represent Technology A X represents Technology B
scrnd R2TCA by Oil Squares represent Technology A X represents Technology B