Download
1 / 28
280 likes | 466 Views
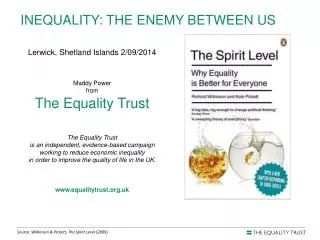
Lerwick , Shetland Islands 2/09/2014 Maddy Power from The Equality Trust The Equality Trust is an independent, evidence-based campaign working to reduce economic inequality in order to improve the quality of life in the UK. www.equalitytrust.org.uk. INEQUALITY : THE ENEMY BETWEEN US.

E N D
Lerwick, Shetland Islands 2/09/2014 Maddy Powerfrom The Equality Trust The Equality Trust is an independent, evidence-based campaign working to reduce economic inequality in order to improve the quality of life in the UK. www.equalitytrust.org.uk INEQUALITY: THE ENEMY BETWEEN US Source: Wilkinson & Pickett, The Spirit Level (2009)
Outline of presentation • Overview of inequality in the UK today • The health and social impacts of inequality • Why are we so sensitive to inequality? • What drives inequality? • Policy and local solutions Source: Wilkinson & Pickett, The Spirit Level (2009)
UK INCOME INEQUALITY TODAY IN £ Average full-time annual pay (2012) for a FTSE 100 Chief Executive Officer = £4.3 million. Average UK worker (2012) = £26,500. Or, if we compare top-to-bottom pay:to earn what a FTSE 100 CEO earns in ONE YEAR a person on National Minimum Wage (£6.31 p/hr) would have to work for …
375 years SOURCES: http://www.equalitytrust.org.uk/resources/infographic-income-inequality-uk http://www.equalitytrust.org.uk/resources/infographic-national-minimum-wage-uk
UK WEALTH INEQUALITY TODAY • Top 1% of households has the same wealth as 54% of the population • Richest 1000 people have more wealth than the poorest 40% of households • Richest 100 saw their wealth increase by £40.1 billion last year, equivalent of £109.95 million a day.
Trends in UK income inequality 1977 – 2011/12 Source: Wilkinson & Pickett, The Spirit Level (2009)
Index includes: • Life expectancy • Maths & literacy • Infant mortality • Homicides • Imprisonment • Teenage births • Trust • Obesity • Mental illness (incl. drug and alcohol addiction) • Social mobility Worse Health and social problems are worse in more unequal countries Index of health and social problems Better High Low Income inequality Source: Wilkinson & Pickett, The Spirit Level (2009)
Worse Health and social problems are worse in more unequal US states Index of health and social problems Better High Low Income inequality Source: Wilkinson & Pickett, The Spirit Level (2009)
Income per head and life expectancy: rich and poor countries Life expectancy (years) National income per person ($) Source: Wilkinson & Pickett, The Spirit Level (2009)
Index includes: • Life expectancy • Maths & literacy • Infant mortality • Homicides • Imprisonment • Teenage births • Trust • Obesity • Mental illness (incl. drug and alcohol addiction) • Social mobility Worse Health and social problems are not related to average income in rich countries Index of health and social problems Better National income per person ($) Source: Wilkinson & Pickett, The Spirit Level (2009)
Worse Health and social problems are only weakly related to average income in US states Index of health and social problems Better Income per person ($) Source: Wilkinson & Pickett, The Spirit Level (2009)
r = -0.44 p-value = 0.04 Life expectancy is longer in more equal rich countries Life expectancy in years High Low Income inequality Source: Wilkinson & Pickett, The Spirit Level (2009)
r = 0.42 p-value = 0.04 Infant mortality rates are higher in more unequal countries Infant deaths per 1000 live births High Low Income inequality Source: Wilkinson & Pickett, The Spirit Level (2009)
Better r = -0.62 p-value = <0.01 Child wellbeing is better in more equal rich countries UNICEF index of child wellbeing Worse High Low Income inequality Source: Wilkinson & Pickett, The Spirit Level (2009)
r = 0.57 p-value = <0.01 More adults are obese in more unequal rich countries Percent obese High Low Income inequality Source: Wilkinson & Pickett, The Spirit Level (2009)
High Index includes use of: • Opiates • Cocaine • Cannabis • Ecstasy • Amphetamines Drug use is more common in more unequal countries Index of drug use r = 0.63 p-value = <0.01 Low High Low Income inequality Source: Wilkinson & Pickett, The Spirit Level (2009)
r = -0.66 p-value = <0.01 Levels of trust are higher in more equal rich countries Most people can be trusted (% agreeing) High Low Income inequality Source: Wilkinson & Pickett, The Spirit Level (2009)
High r = -0.45 p-value = 0.04 Educational scores are higher in more equal rich countries Average of maths and reading scores Low High Low Income inequality Source: Wilkinson & Pickett, The Spirit Level (2009)
High r = 0.93 p-value = <0.01 Social mobility is lower in more unequal countries Social mobility Low High Low Income inequality Source: Wilkinson & Pickett, The Spirit Level (2009)
Why are we so sensitive to inequality? Research shows that the key psycho-social risk factors for ill health are: • Low social status (social-evaluative threat) • Weak social affiliations (friends & community) • Stress in early life (pre and post-natal) ALL of the above are exacerbated in more unequal societies. Source: Wilkinson & Pickett, The Spirit Level (2009)
Value or devalued? More inequality • More superiority and inferiority • More status competition and consumerism • More status insecurity • More worry about how we are seen and judged • More “social evaluation anxiety”(threats to self-esteem & social status, fear of negative judgements Source: Wilkinson & Pickett, The Spirit Level (2009)
What kinds of stressful tasks raise stress hormones most? Cortisolresponse (effect size) Tasks with ‘social evaluative threat’ (uncontrollable) Other tasks Dickerson SS, Kemeny ME. Acute stressors and cortisol responses. Psychological Bulletin 2004; 130(3): 355-91. Source: Wilkinson & Pickett, The Spirit Level (2009)
What drives inequality? • Family • Childhood • Globalisation • Technology • Political systems and institutions
What are the policy solutions to inequality? • Vocational education • Active welfare programmes • Council tax • Work place commission • Auditing
What can be done at a local and individual level? Join The Equality Trust:* donate - equalitytrust.org.uk/support* sign-up - equalitytrust.org.uk/newsletter-signup Learn and teach by:* visiting equalitytrust.org.uk* especially equalitytrust.org.uk/about-inequality Act by:* join or form a local group in Lerwick* telling all your friends, family and colleagues about us! Source: Wilkinson & Pickett, The Spirit Level (2009)