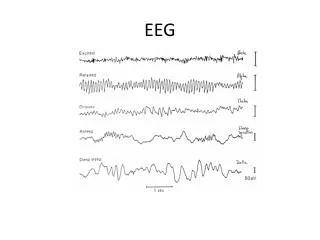
Python EEG Analysis Example
Python EEG Analysis Example. From Think Python How to Think Like a Computer Scientist. EEG Data Collection. Their Test Bench. Generates a CSV File Looks like the following in Excel. Channels. sample number. Looking at it in Notepad++.


Python EEG Analysis Example
E N D
Presentation Transcript
PythonEEG Analysis Example From Think Python How to Think Like a Computer Scientist
Generates a CSV FileLooks like the following in Excel Channels sample number
Suppose we just want channel 2 and none of the other data. We will use Python to extract that column only. Once it is extracted we can graph it.
Open the file and read it. • File=open("eegdata.csv",'r') • File.readline(); # Get rid of the first line. • # It contains only header data • for line in File: • print line • # The above should open the file and print it out one line at a time. • # As soon as this works we can then process each line
Remember SPLIT? • If we have a string (or line) that is a CSV string we can split it into pieces and place the result into a list. • Example : str = “34,23,65,77,12” • a = str.split(‘,’) • print a • ['34', '23', '65', '77', '12'] • But these are strings in a list and not numbers. So. • a[2] is ‘65’ . Can we convert this guy to a float? • float(a[2]) is now 65 Capice?!
The Script • File=open("eegdata.csv",'r') • File.readline(); • channel = [] • for line in File: • list=line.split(',') • channel.append(float(list[2])) • print channel • plot (channel[0:128)) # only plot the first 128 samples
What about multiple graphs • File=open("eegdata.csv",'r') • File.readline(); • channel = [] • for line in File: • list=line.split(',') • channel.append(float(list[2])) • print channel • figure(1) • plot(channel[:128]) • figure(2) • plot(channel[128:256])