Download
1 / 20
200 likes | 221 Views
Explore the intricate language of the brain through action potentials, chemistry, and electrical circuits. Delve into the dynamics of ion channels and membrane potentials in nerve impulse simulations.

E N D
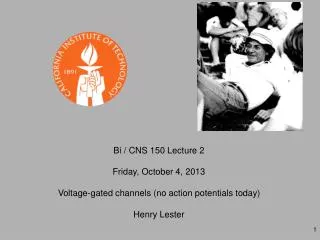
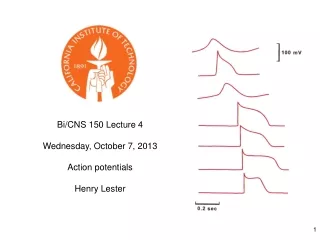
Bi/CNS 150 Lecture 4 Wednesday, October 7, 2013 Action potentials Henry Lester
V, I Electricity is a Language of the Brain. Intracellular recording with sharp glass electrodes. 1. A current applied by the experimenter increases firing rates Prof. David McCormick’s data https://medicine.yale.edu/lab/mccormick/movies/
V Chemistry is also a language of the brain. 2. Artificially applied acetylcholine acts on muscarinic receptors to change the membrane potential, increasing action potential frequency. Prof. David McCormick’s data https://medicine.yale.edu/lab/mccormick/movies/ (The spikes in these examples are about 100 mV in amplitude)
Today’s lecture employs electrical circuits Review your material from Phys 1b, practical See also Appendix A in Kandel
Atomic-scale structure of (bacterial) Na+ channels (2011, 2012) Views from the extracellular solution electrically, open channel = conductor Views from the membrane plane
GK = SgK GK gK EK (- 60 mV) gK The miniature single-channel conductors add in parallel GNa = SgNa outside GNa gNa = ENa (+60 mV) cytosol = inside gNa mostly Na+ mostly K+
+ + E G E G E G peak of action potential: Na+ channels open too D = K K Na Na Cl Cl V + + G G G K Na Cl The membrane potential at steady state (not at equilibrium) At DC, IC = CdV/dt = 0, so resting potential: K+ channels open outside Cl- K+ Na+ G C E “after-hyperpolarization”: more K+ channels open cytosol = inside
Simulation of the nerve impulse (“unclamped”) Francisco Bezanilla's simulation program at the Univ of Chicago: http://nerve.bsd.uchicago.edu/
Simulation of the nerve impulse (“unclamped”) Spatially homogeneous membrane (“membrane AP”). Either spherical, or patch, or wire in axon. First, show passive properties of membrane Turn off conductances. Ampl ± 2, delay 10, duration 15, total time 40 Now back to default (“reset parameters”) Note threshold. Vary pulse amplitude (2 to 20 mA). Note constant amplitude Note hyperpolarization. Plot G(K), G(Na) and note that hyperpolarization is caused by G(K). “Refractory” period 30 ms total time, vary pulse 2 duration, pulse 3 = 30 mA. Plot G(K) simultaneously.
Simulation of the nerve impulse (“unclamped”) Repetitive firing: the frequency code total time to 40 ms; lengthen pulse 1 to 30 ms, Vary pulse amp from 2, 5, 10. Note the smaller AP’s—the squid axon is not specialized for repetitive firing. (For robust frequency encoding, we require at least one additional type of K+ channel.)
Cable properties of the Axon Francisco Bezanilla's simulation program at the Univ of Chicago: http://nerve.bsd.uchicago.edu/nerve1.html Click on Voltage Plot, V vs T. Start Parameter edits are not useful.
Simulation of the nerve impulse (“unclamped”) http://nerve.bsd.uchicago.edu/nerve1.html Propagation (V vs. t) Measure propagation velocity: set blue electrode at 2 cm 6.18 ms – 3.88 ms = 2.3 ms 30 mm/2.3 ms = 11 mm/ms = 13 m/s. Pretty fast! At 30o C, 2.89 ms - 1.47 ms = 1.42 ms 30 mm / 1.42 ms = 21.1 m/s. Faster
There are dozens of V-gated channels, Causing the variety of action potential waveforms
An approximate explanation for the electrocardiogram, slide 1 The left ventricle pumps against the greatest resistance therefore it has thickest walls; therefore its currents are the largest; therefore it contributes most of the ECG.
The capacitive currents are largest Cl- K+ Na+ An extracellular electrode pair records IR drops proportional to the (absolute value) of the 1st derivative of membrane potential. G C E An approximate explanation for the electrocardiogram, slide 2 extracellular Cl- K+ Na+ G C E cytosol
extracellular K+ Cl- Na+ K+ Cl- Na+ G G C C E intracellular E An approximate explanation for the electrocardiogram, slide 3 chest Only a small fraction of the current flows across the resistance between chest and a limb. This produces a DV ~ 103 times smaller than the transmembrane potential. The ECG records this signal leg
Na+ channels conduct K+ channels conduct R T P Q S Action potentials and the electrocardiogram Action Potential measured with intracellular electrode ~ 100 mV ~ 1 sec Electrocardiogram measured on the skin ~ 100 mV ST depression is a common anomaly, implying that additional current flows between sections of the heart during the “plateau”
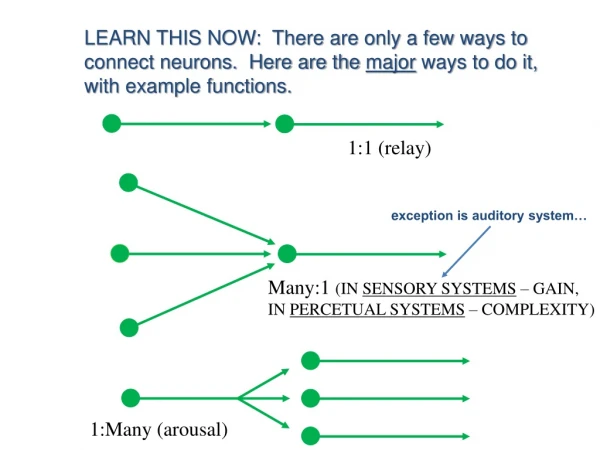
The frequency of impulses represents signaling among cells in the nervous system. -from sense organs to the brain -within the brain -from the brain to muscles -even in a muscle or in the heart -even in the pancreas
V Intracellular recording with sharp glass electrodes A cell is receiving stimuli from other cells, not from the experimenter http://info.med.yale.edu/neurobio/mccormick/movies/rly_exp.mpg Same data; choice of formats. Media player required http://info.med.yale.edu/neurobio/mccormick/movies/rly_exp.avi (The spikes in these examples are about 100 mV in amplitude)