Download
1 / 61
610 likes | 736 Views
Chaos, Fluid Mixing, Uncertainty. James Glimm Department of Applied Mathematics & Statistics State University of New York Stony Brook, NY 11794-3600 Center for Data Intensive Computing Brookhaven National Laboratory Upton, NY 11973-5000 - with -

E N D
Chaos, Fluid Mixing, Uncertainty James Glimm Department of Applied Mathematics & Statistics State University of New York Stony Brook, NY 11794-3600 Center for Data Intensive Computing Brookhaven National Laboratory Upton, NY 11973-5000 - with - D. Sharp, B. Cheng, X.L. Li, H. Jin, D. Saltz, Z. Xu, F. Tangerman, M. Laforest, A. Marchese, E. George, Y. Zhang, S. Dutta, H. J. Kim, Y. Lee, K. Ye, S. Hou
Chaos and Prediction Chaos: Sensitive dependence on data, for example, initial conditions Result: Predictability lost Cure: Predict averages, statistics, probabilities Result: Predictability regained
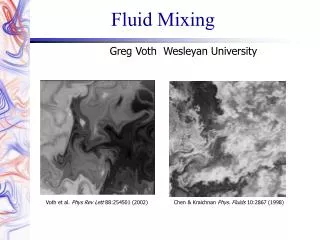
Examples 1. Fluid Mixing - acceleration of density contrasting layers - unknown and sensitive initial data 2. Flow in Porous Media - unknown heterogeneous geology
Prediction for Multiscale Chaos - Fine scale features influence macroscopic flow - Multiscale defines frontier problems in many areas of science
Basic Methods I. Fine Scale Science - Study single unstable mode - Study mode coupling and interactions - Analytic methods - DNS = direct numerical simulation
Basic Methods II. Micro-Macro Coupling - Statistical models of mode interactions - Statistical analysis of DNS III. Macro Theories - Averaged equations - Validated by comparison to I, II - Validated by comparison to experiment - Mathematical analysis of averaged equations
Basic Methods IV. Prediction and Uncertainty - Errors in micro-macro approximation - Errors in numerics and experiment - Observational/exp. data: reduce uncertainty - Statistical inference: quantify uncertainty
Fluid Mixing Simulation Early time FronTier simulation of Late time FronTier simulation of a 3D RT mixing layer. 3D RT mixing layer.
Comparison to Laboratory Experiments penetration distance of light fluid into the heavy fluid (bubbles)
FronTier and TVD Simulations Compared with Experiment b = 0.06-0.07 FronTier (above) b = 0.03-0.04 TVD (below) b = 0.05 Experiment (Dimonte) b = 0.06 - 0.07 (Youngs)
Comparison of Simulations FT nondiffusive across interface TVD diffusive across interface Mass diffusion appears to cause ~ 50% error in mixing rate.
Cross Section & Mass Diffusion: Comparison of TVD and FronTier TVD FronTier
Simulation in Spherical Geometry Cross-sectional view of the growth of instability in a randomly perturbed axisymmetric sphere driven by an imploding shock wave in air. The shock Mack number M is 1.2 and the Atwood number A is 2/3.
Spherical Mix, Later Time Later time in the instability evolution.
Analytic Models Statistical Models of Interacting Bubbles Bubble Merger Models Advanced bubble Retarded bubble Advanced bubble Bubble velocity = single mode velocity + envelope velocity
Analytic Models Statistical Models of Interacting Bubbles Bubble Merger Models Advanced bubble Retarded bubble Advanced bubble Bubble velocity = single mode velocity + envelope velocity
Bubble Merger Criterion Envelope velocity > 0 advanced bubble Envelope velocity < 0 retarded bubble Remove bubble from ensemble where velocity = 0: single mode velocity = envelope velocity
Statistical Physics Model of Mixing Rate Solve statistical bubble model at renormalization group fixed point B. Cheng, J. Glimm, D. Sharp b 0.05 - 0.06
COM Hypothesis Stationary Center of Mass (COM) (approx. valid unless A 1) hs = penetration of heavy fluid into light hs = s Agt2 (RT) COM s / b = solution of quadratic equation s = s (b) B. Cheng, J. Glimm, D. Saltz, D. Sharp
Mixing Zone Edge Models Zb,s (t) = mixing zone edge = hb,s in RT case = bs Agt2in RT case Buoyancy Drag equation for Zb,s (t): Determine Cb,s from FT theory above ODE valid for arbitrary acceleration
Chunk Mix Model • Complete fluid variables for each fluid -- Mathematically stable equations • Improved physics model for mix -- Pressure difference forces ~ drag • Thermodynamics is process independent • New closure proposed and tested -- Zero parameters (incompressible flow) • Analytic solution for incompressible case
Multiphase Averaged Equations Microphysics: Macrophysics: Closure Problem: Determine Fren
Ensemble Averages Assume two fluids, labeled k=1 (light) and k=2 (heavy). Define
Closure Assume: v* depends on v1 and v2 and spatially dimensionless quantities only. Assume: regularity of v*. Theorem: (convex combination) and related relations for p* and (pv)* Assume: all ’s depend on k and t only.
Explicit Model: Zero Parameters (incompressible) One Parameter (compressible) Assume are fractional linear in k. Then with k’ denoting the other fluid index and With the mixing zone boundaries Zk(t), and velocities Vk(t), for incompressible flow. Boundary accelerations must be must be supplied externally to this model. Drag + buoyancy
Asymptotic Expansion in Powers ofM = Mach Number 0th order = incompressible v, 1st order = correction v, 2nd order = incompressible p1, p2 + v, correction 2nd order p1, p2 = incompressible p1, p2 constraint: “missing” incompressible pressure equation
Summary: Multiscale Science Multiple Methods to Solve Chaotic Mix Problem -- Analytic Methods -- Microscopic Simulation (DNS) -- Edge Motion Models -- Averaged Solutions Closed Form Solutions Asymptotics Numerical Solutions
Summary: Multiscale Science Scientific Understanding: Consistent theory, experiment, simulation Still Needed: Other mix/chaos problems Transients, shock waves Validation, comparison to other closures FronTier Lite Tech transfer to other codes
Prediction and Uncertainty for Chaotic Flow • Prediction of Oil Reservoir Production • Confidence Intervals • Allows Evaluation of Risk in Decision Making • Reservoir Development Choices • Sizing of Production Equipment • Location of New Wells
Basic Idea: I • Match geology to past oil production datai with probability of error • Start with geostatistical probability model for geology (permeability, etc). • Observe production rates, etc.
Basic Idea: II • Multiple simulations from ensemble • (Re)Assign probabilities based on data, degree of mismatch of simulation to history
Basic Idea: III Redefine probabilities and ensemble to be consistent with: (a) data (b) probable errors in simulation and data
Basic Idea: IV New ensemble of geologies = Posterior Prediction = sample from posterior Confidence intervals come from - posterior probabilities - errors in forward simulation
New Result: Predict outcomes and risk Risk is predicted quantitatively Risk prediction is based on - formal probabilities of errors in data and simulation - methods for simulation error analysis - Rapid simulation (upscale) allowing exploration of many scenarios
Problem Formulation Simulation study: Line drive, 2D reservoir Random permeability field log normal, random correlation length
Simple Reservoir Description in unit square constant
Ensemble 100 random permeability fields for each correlation length lnK gaussian, correlation length
Upscaling Solution from fine grid 100 x 100 grid Solution by upscaling 20 x 20, 10 x 10, 5 x 5 Upscaled grids
Upscaling References Upscaling by Wallstrom, Hou, Christie, Durlofsky, Sharp 1. Computational Geoscience 3:69-87 (1999) 2. SPE 51939 3. Transport in Porous Media (submitted)
Examples of Upscaled, Exact Oil Cut Curves Scale-up: Black (fine grid) , Red (20x20), Blue (10x10), Green (5x5)
Design of Study Select one geology as exact. Observe production for Assign revised probabilities to all 500 geologies in ensemble based on: (a) coarse grid upscaled solutions (b) probabilities for coarse grid errors. Compared to data (from “exact” geology)
Bayes Theorem Permeability = geology Observation = past oil cut prior posterior;
Errors and Discrepancies Fine Coarse usually but implies geology geology