Download
1 / 42

E N D
WEEK 5: Air Masses & Fronts
01 AIR MASSES & FRONTS
Air Masses & Fronts PHENOMENA OUTCOME ESSENTIAL QUESTION What do spaghetti models show us? I Can: Identify air masses and fronts on a weather map and describe the weather they produce. Why is the weather always changing?
STEMScopes Streaming Weather Changes • What makes predicting weather in the United Kingdom challenging? • How many air masses dominate the United Kingdom in comparison to most places in the world? • Why is the weather in the United Kingdom constantly changing? • What dictates the type of weather Great Britain receives? • What brought extreme weather to Great Britain? 3:47 https://app.acceleratelearning.com/media_assets/94
Video Questions and Answers • What makes predicting weather in the United Kingdom challenging? It is constantly changing. • How many air masses dominate the United Kingdom in comparison to most places in the world? The United Kingdom has four, while most other places have one or two. • Why is the weather in the United Kingdom constantly changing? No air mass dominates for a long period of time. • What dictates the type of weather Great Britain receives? The jet stream • What brought extreme weather to Great Britain? One of the four major air masses got stuck over Great Britain.
STEMScopes Predicting Weather EXPLAIN - Content Connections Video Weather Changes • What five factors determine local weather patterns? • Explain what causes weather to change over time. • Describe an air mass and its front. • What is the purpose of weather maps? • List at least three examples of data included on weather maps. 1:36 https://app.acceleratelearning.com/scopes/13725/elements/883701
Video Questions • What five factors determine local weather patterns? Land and ocean temperatures, local air pressure, humidity, prevailing winds, and ocean currents • 2. Explain what causes weather to change over time. Air masses flow from regions of high pressure to regions of low pressure. • 3. Describe an air mass and its front. An air mass is a volume of air defined by its temperature and water vapor content. A front is the leading edge of an air mass that comes in contact with other air masses. • 4. What is the purpose of weather maps? Weather maps show the conditions at a specific time and place. • 5. List examples of data included on weather maps. Precipitation, wind direction, temperature, cloud cover, high or low pressure, cold and warm fronts, or stationary and occluded fronts.
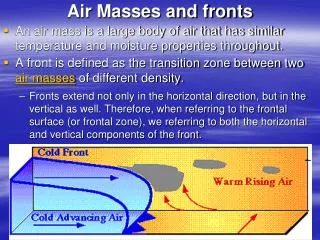
WHAT IS AN AIR MASS? It can cover hundreds of thousands of square miles. Air masses form when a surface source region (continental or maritime) combines with a latitude source region (tropical, polar, arctic or Antarctic). Air masses are defined by the surface they're over along with characteristics that they take on from those surfaces (moisture, temperature, heat, etc). Each of the air mass types produce different weather and can affect the earth’s climate for days or months. An air mass is a huge body of air that has the same temperature, humidity, and air pressure throughout.
Did it form over WATER? Did it form over LAND? Did it form at a HIGH LATITUDE? Did it form at a LOW LATITUDE? WHAT MAKES DIFFERENT AIR MASSES? The type of air mass that forms in an area depends on these factors: (Near the Equator) 0 ----------------------------------------------------------------- (Near the Poles) -90 ----------------------------------------------------------------
If the air mass forms over land, will it be dry or wet? DRY If the air mass forms over a low latitude (closer the equator), will it be warm or cold? Warm WET If the air mass forms over water, will it be dry or wet? Cold If the air mass forms over a high latitude (close to poles), will it be warm or cold? YOU DECIDE...
Types of Air Masses Generally, there are four types of air masses that can be further categorized with specifics of where they occur and over water or land. The 4 types of air masses are polar, tropical, continental and maritime. **Remember, air masses are able to be classified based on the location of the mass, what kind of land/water/surface it's positioned over and the characteristics it takes on from those locations (temperature, heat, moisture, etc). Continental Polar (cP) The continental polar air mass forms over a large, subpolar land area. It is cold and stable and has low humidity. This type of air mass creates very cold winter weather without precipitation or clouds. It is often responsible for lengthy cold spells that result in crop damage as far south as Florida. During the summer, this type of air mass can bring cooling relief to the northern United States with its cold air and winds. Continental Arctic (cA) The continental Arctic air mass develops only in the winter over large areas of snow and ice. It is extremely cold and dry due to frigid conditions near the polar circle, caused in part by polar nights, which are periods of 24-hour darkness. This air mass can produce record-breaking cold temperatures in Canada and the United States.
Continental Antarctic (cAA) As the name suggests, the continental Antarctic air mass forms solely over Antarctica. It is stable, extremely cold and extremely dry. It has colder temperatures than any other air mass during any season. Travel over the ocean modifies this air mass. By the time it reaches land in the Southern Hemisphere, it usually changes classification to maritime polar as it is no longer over the antarctic source surface area. Continental Tropical (cT) Continental tropical air is produced over the world’s deserts, including the Sahara, Arabian and Australian deserts. The southwestern desert in the U.S. is also a source of this type of air mass during the summer. The air mass is hot and has extremely low humidity. It affects summer weather and is capable of causing drought if it lingers over a region. Heat waves that result in human and animal deaths can be caused by this air mass. Maritime Polar (mP) The maritime polar air mass forms over cold, polar oceans. It is cool and moist and can create mild weather in coastal areas depending on the time of year. In the winter, it produces warmer weather when the surface temperature of the ocean is higher than the land temperature. In the summer, it brings cooler weather when the ocean is colder than the continent. Maritime Tropical (mT) The principal type of maritime air is maritime tropical. This very warm and humid air mass develops over tropical and subtropical seas and oceans. It creates rainy conditions east of the Rocky Mountains in the winter, particularly in the southeastern United States.
HOW ARE AIR MASSES NAMED? Air masses have first and last names. Maritime (m) = Over Water Continental (c)= Over Land FIRST Tropical (T)= Low Latitude Polar (P)= High Latitude LAST The first name of the air mass tells us where it forms and its moisture (over land is dry or over water is wet) The last name tells us the temperature of the air mass (polar is cold or tropical is warm)
HOW DO AIR MASSES MOVE? WHAT HAPPENS IF TWO AIR MASSES MEET? Air masses are pushed across continents by global winds. When two different air masses meet and don’t mix, a front forms. The collision between the air masses causes storms and changeable weather.
COLD FRONT COLD FRONT COLD FRONT WARM FRONT WARM FRONT
Weather fronts are always going to be pushed from high pressure areas to near by low pressure areas. Warm Front:when warm air mass slowly slides up and over a cold air mass. Cold Front: when cold air mass pushes under a warm air mass and forces it to rise quickly. Using what you have learned about fronts, predict the weather in the following cities.
02 Using Air Pressure to Predict AIR MASSES & FRONTS
Using Air Pressure to Predict Air Masses & Fronts PHENOMENA OUTCOME ESSENTIAL QUESTION What do spaghetti models show us? I Can: Analyze changes in air pressure on a weather map to determine where fronts will form. How can you use information on changes in air pressure to determine weather patterns?
STEMScopes Predicting Weather EXPLAIN - STEMScopedia Reflect (pg. 4-5) Review: Air Masses & Fronts https://app.acceleratelearning.com/scopes/13725/elements/660722
Weather in Air Masses The type of weather conditions that exist within an air mass after it leaves its area of origin depends on whether the surface it is traveling across is colder or warmer than the air mass. If the ground or body of water that the air mass is passing over is colder than the air mass, one of two phenomena usually occur. As a moist air mass passes over a cold surface, the moisture in the lower levels of the air mass often condense to form dew, fog, drizzle or light rain. If there is a dry air mass, a temperature inversion may occur in which a layer of cold air is trapped beneath the warmer air mass. As a result, smoke dust and other pollutants cant rise and a haze or brown cloud develops. Such temperature inversions are common in Denver and other cities during the winter months. If a moist air mass crosses a surface warmer than the air mass, convection currents start to generate wind and cumulus clouds are formed as moist air warmed by the surface begins to rise. If the warm surface is a lake or ocean or if the air mass is very moist, cumulonimbus clouds may develop and generate strong rain showers. A dry air mass crossing a warmer surface usually creates clear and sunny conditions. https://aacps.discoveryeducation.com/learn/videos/d8a997f6-3a09-4664-9fc8-055934714c36
Mostly,cumulus cloudsindicate fair weather, often popping up on bright sunny days. Though if conditions allow, cumulus can grow into cumulonimbus clouds. Cumulonimbus clouds are associated with extreme weather such as heavy torrential downpours, hail storms, lightning and even tornados.
Anticyclone: a weather system with high atmospheric pressure at its center, around which air slowly circulates in a clockwise (northern hemisphere) or counterclockwise (southern hemisphere) direction. Anticyclones are associated with calm, fine weather.
Low pressure = Air rises & Bad Weather
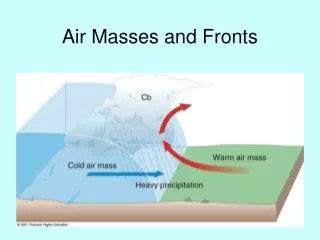
Air Mass Boundaries: Fronts • Along areas called fronts that lie at the boundary between air masses, the formation of clouds and levels of precipitation whether rain or snow are usually more greater than they are within air masses. In fact on satellite weather maps the movement of air masses is usually obvious, do to the high concentration of clouds found along weather fronts. • The movement of a front through an area always creates some kind of change in the weather. A sloping intersection between air masses is always formed along the front and the cold air mass is always wedged below the warm air mass. https://aacps.discoveryeducation.com/learn/videos/438de943-2079-4459-bb39-6bd2588e3668
Animated Video of the 4 Types of Fronts 2:18 https://www.youtube.com/watch?v=5Cnx5Bzctas
INTERPRETING A SURFACE AIR PRESSURE MAP OBJECTIVE Analyze the changes in pressure on a weather map to determine where cold fronts and warm fronts are likely to be found. BACKGROUND The motion of air in the atmosphere above our heads plays a large part in the weather we experience here at Earth’s surface. Basically, air cools as it rises, which can cause water vapor in the air to condense into liquid water droplets, sometimes forming clouds and precipitation. On the other hand, sinking air is associated with warming and drying conditions. So the first important point to keep in mind is rising air = moistening, sinking air = drying. High pressure is associated with sinking air, and low pressure is associated with rising air. Cold fronts are often located in areas where the pressure change is the greatest. The front represents the boundary of different air masses. Cold air is more dense than warm air so when a cold front passes your location, the pressure increases. We analyze for pressure change to look for these boundaries. We can also tell where high pressure and low pressure systems are moving by looking where the greatest change is occurring.
INTERPRETING A SURFACE AIR PRESSURE MAP Diagram showing the formation of clouds in an area of low pressure. Air from a high pressure region (blue arrows) moves into an area of low pressure and rises upwards (red arrows). As this air ascends due to the low pressure, it cools and the moisture in it condenses to form clouds, which may then release the moisture in the form of rain. 1:39 https://www.youtube.com/watch?v=SWHj71qS_NA
INTERPRETING A SURFACE AIR PRESSURE MAP • 2. Draw the remaining "positive" pressure change value(s) at two millibars intervals. Using a blue scribble, beginning at any +2 value, lightly draw lines connecting equal values of the +2 millibars pressure change. Remember, the change in pressure represents the edge of an air mass, so the air masses won’t overlap. Therefore, the lines you draw should not cross. Your map should look like this:
3. Using the black scribble, draw a line connecting the zero (0). Remember, this line represents where the air pressure is the same as it was three hours ago. The pressure could have risen then fallen, remained steady, or could have fallen and then returned to what was observed three hours ago. • 4. Finally, using red scribble lightly draw a line connecting equal pressure change values of less than zero (0). The air pressure is lower now than three hours previously.
INTERPRETING A SURFACE AIR PRESSURE MAP ANALYSIS Shade, in red, the region where the surface pressure change is -4 millibars or less. Shade, in blue, the region where the surface pressure change is +4 millibars or more. Label the cold air mass(es) on your map. Label the warm air mass(es) on your map. Label the cold front(s) on your map. Label the warm front(s) on your map.
Other Good Videos Weather Fronts animated video 3:12https://www.youtube.com/watch?v=tkK4_F0VKhM Please keep this slide for attribution