Download
1 / 27
270 likes | 376 Views
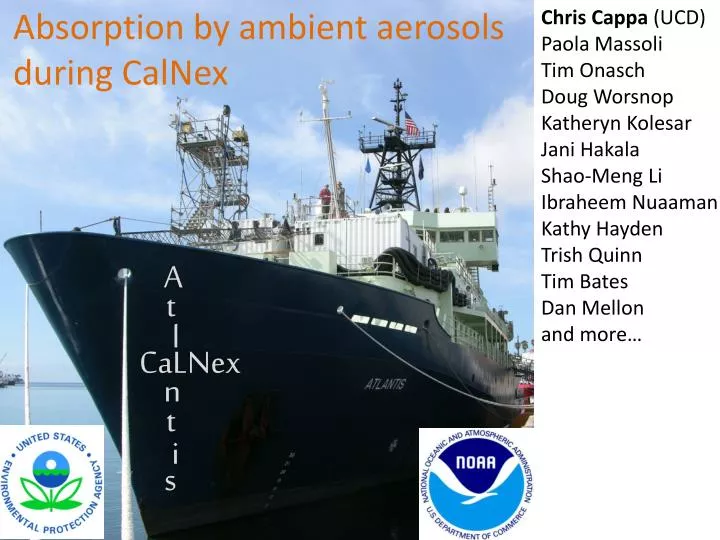
Chris Cappa (UCD) Paola Massoli Tim Onasch Doug Worsnop Katheryn Kolesar Jani Hakala Shao- Meng Li Ibraheem Nuaaman Kathy Hayden Trish Quinn Tim Bates Dan Mellon and more…. Absorption by ambient aerosols during CalNex. A. t. l. CaLNex. n. t. i. s.

E N D
Chris Cappa(UCD) Paola Massoli Tim Onasch Doug Worsnop KatherynKolesar JaniHakala Shao-Meng Li IbraheemNuaaman Kathy Hayden Trish Quinn Tim Bates Dan Mellon and more… Absorption by ambient aerosols during CalNex A t l CaLNex n t i s
Aerosol Volatility and Optical Properties Light absorption by particles from black carbon (soot) and browncarbon Coatings on BC can theoretically enhance absorption in climatically important ways [e.g. Jacobson, Nature, 2001] Enhancement factor can be calculated from Mie theory, but limited validation from ambient measurements Objective: to directly measure the absorption enhancement factor for ambient particles at multiple wavelengths [Lack and Cappa, ACP, 2010]
Approach: Heat Particles to Drive Off Coatings Ambient Really hot Large Enhancement Small Enhancement Highly Scattering Less Scattering Brown Carbon No Brown Carbon Absorption by brown carbon should contribute more to total absorption at short l
Measurements MAST Note: PM1 cutoff or Env. Ca Env. Ca Aerodyne Env. Ca UC Davis Thermo- denuder HR-ToF-AMS SP-AMS PAS/CRD SMPS SP2 BC mass distribution Non-refractory particle composition BC & coating composition Size Distribution Particle absorption & extinction • PAS/CRD measures light absorption and light extinction at 532 nm and 405 nm • SP-AMS measures BC mass and coating composition • SP2 measures BC mass and infers coating thickness • SP2 and SPAMS tell us something about how coating thickness has changed upon heating • SP2 BC measurement can tell us about particle losses through the TD
Particle Transmission Correction Similar results to Huffman et al. (2008): Tr = 0.98 – 0.00082*Temp
Influence of heating on particle extinction (532 nm) Black = ambient Red = denuded
Influence of heating on particle extinction Start of Campaign End of Campaign Lines are binned data over different time periods Total aerosol volatility varies greatly with time/location Very similar results from SMPS
Influence of heating on particle absorption 532 nm Note: only include periods when babs,ambient> 0.5 Mm-1 405 nm
Influence of heating on particle absorption 532 nm 405 nm
Theoretical Calculations of Aerosol Optical Properties Use “core-shell” Mie theory to calculate evolution of sabs, sext and SSA Dp(particle) = 400 nm Dp(core) = 80 nm sabs = 9.8 x 10⁻¹⁵ m2/particle sext = 2.9 x 10⁻¹³ m2/particle SSA = 0.97 Dp(particle) = 100 nm Dp(core) = 80 nm sabs = 3.8 x 10⁻¹⁵ m2/particle sext = 4.4 x 10⁻¹⁵ m2/particle SSA = 0.13 Eabs = 2.57 FRext = 0.015 DSSA = 0.84 Dp(particle) = 200 nm Dp(core) = 60 nm sabs = 2.9 x 10⁻¹⁵ m2/particle sext = 1.5 x 10⁻¹⁴ m2/particle SSA = 0.81 Dp(particle) = 120 nm Dp(core) = 60 nm sabs = 2.0 x 10⁻¹⁵ m2/particle sext = 2.8 x 10⁻¹⁵ m2/particle SSA = 0.16 Eabs = 1.45 FRext = 0.19 DSSA = 0.65
Model: Mie Core-Shell Dp = 250 nm SSAi = 0.95; Dcore = 50 nm
Model: Mie Core-Shell Dp = 250 nm SSAi = 0.95; Dcore = 50 nm SSAi = 0.88; Dcore = 70 nm SSAi = 0.77; Dcore = 90 nm SSAi = 0.67; Dcore = 110 nm
Model: Mie Core-Shell SSAi = 0.95 SSAi = 0.88 SSAi = 0.77 SSAi= 0.67; vary Dp SSAi = 0.58 Dp = 150 nm Dp = 100 nm Dp = 80 nm
Since we are talking about California anyway… same experiment done at CARES, but with fixed TD temperature (225 °C) and PM2.5 Note: variation in FRext from atmosphere, not temperature
Why such an (unexpectedly) low absorption enhancement? 1. Concern: particles are not internally mixed + 2. Particles are internally mixed, but not with “core-shell” morphology
Points = observed Lines = calculations Dp,core = 40 nm Dp,core = 140 nm
SP-AMS sees only particles that contain black carbon SSA shows similar variation with which would only be the case if particles are internally mixed. Dp,core = 40 nm Dp,core = 140 nm
Brown Carbon Absorption ~10% of absorption at 405 nm may be due to “Brown” Carbon Imaginary Refractive Index ~ 0.009
Conclusions Absorption enhancements much smaller than expected Suggests internal mixtures but not with “core-shell” morphology Absorption by “brown” carbon ~ 10% of total at 405 nm Thanks again to all my great collaborators, the R/V Atlantis Crew and the EPA and NOAA for funding.