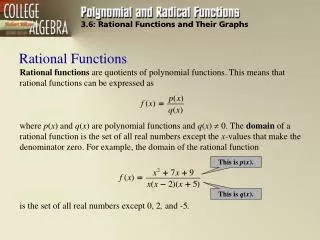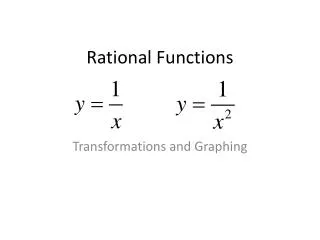
Rational Functions
Rational Functions. Objective: To graph rational functions without a calculator using what we have learned. Things to look for. When graphing rational functions, there are certain things that we need to know. Intercepts Asymptotes Increasing/Decreasing


Rational Functions
E N D
Presentation Transcript
Rational Functions Objective: To graph rational functions without a calculator using what we have learned.
Things to look for • When graphing rational functions, there are certain things that we need to know. • Intercepts • Asymptotes • Increasing/Decreasing • Concave up/Concave down/inflection points • Relative extrema
Example 1 • Sketch the graph of
Example 1 • Sketch the graph of 1) When x = 0, y = ½ 2) This function will equal zero when the numerator is equal to zero. The y-intercepts are (2,0) and (-2,0)
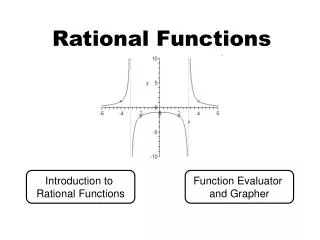
Example 1 • Sketch the graph of 3) The vertical asymptotes are the zeros of the denominator which are x = + 4. 4) The horizontal asymptote is the limit of the function as . Here, since the numerator and denominator are the same degree, the horizontal asymptote is y = 2.
Example 1 • Sketch the graph of • The graph will never cross a vertical asymptote, but may cross a horizontal asymptote. To see if this happens, we set the equation equal to the asymptote and see if there is an x value that will produce the given y value.
Example 1 • Sketch the graph of • The graph will never cross a vertical asymptote, but may cross a horizontal asymptote. To see if this happens, we set the equation equal to the asymptote and see if there is an x value that will produce the given y value. • This is never true, so it will not cross the asymptote.
Example 1 • Sketch the graph of ___+___| ____+____|____-____|___-___ Inc -4 Inc 0 Dec 4 Dec r max
Example 1 • Sketch the graph of ______+____|______-______|___+____ c up -4 c down 4 c up
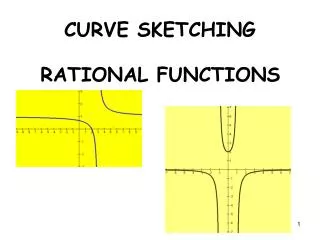
Example 1 • Here is what the graph looks like. ___+___| ____+____|____-____|___-___ Inc -4 Inc 0 Dec 4 Dec r max ______+____|______-______|___+____ c up -4 c down 4 c up
Example 3 • Graph • y-intercept (0, -42/3) • X-intercept (4, 0) • No horizontal or vertical asymptote.
Example 3 • Graph • y-intercept (0, -42/3) • X-intercept (4, 0) • No horizontal or vertical asymptote. • ___-___|___+___ dec 4 inc c.p. (min) 5) ___-___|___-___ c d 4 cd cusp
Example 4 • Graph • y-intercept (0, 0) • x-intercept (-2, 0) and (0, 0) • No asymptotes dec inc inc ____-___|___+___|___+___ -1/2 0 min (s.p.) c.p.
Example 4 • Graph • y-intercept (0, 0) • x-intercept (-2, 0) and (0, 0) • No asymptotes cu cd cu ____+___|___-___|___+___ 0 1 i.p. i.p.
Example 4 • Graph dec inc inc ____-___|___+___|___+___ -1/2 0 min (s.p.) c.p. cu cd cu ____+___|___-___|___+___ 0 1 i.p. i.p.
Homework • Section 4.3 • 1, 3, 5, 25, 33,35