Cost Allocation
Cost Allocation. B.COM REGULAR & PRIVATE. PART 1 ACCOUNTING, STATISTICS & ECONOMICS. PART 2 ADVANCED & COST ACCOUNTING, BUSINESS LAW, AUDITING & TAX. MA-ECONOMICS EXTERNAL. PREVIOUS MICRO ECONOMICS & STATISTICS FINAL MACRO ECONOMICS. Learning Objective 1.


Cost Allocation
E N D
Presentation Transcript
B.COM REGULAR & PRIVATE • PART 1 ACCOUNTING, STATISTICS & ECONOMICS. • PART 2 ADVANCED & COST ACCOUNTING, BUSINESS LAW, AUDITING & TAX.
MA-ECONOMICSEXTERNAL • PREVIOUS • MICRO ECONOMICS & STATISTICS • FINAL • MACRO ECONOMICS
Learning Objective 1 General Framework for Cost Allocation Cost allocation methods comprise an important part of a company’s cost management system. Four types of cost objectives: Service departments Producing departments Products/services, and Customers.
General Framework for Cost Allocation Producing departments are where employees Work on the organization’s products or services. Service departments exist only to support other departments or customers.
General Framework for Cost Allocation Direct costs can be physically traced to each department. Indirect costs must be allocated. Many companies develop allocation methods to assign service department costs to the producing departments.
General Framework for Cost Allocation All organizations accumulate costs for their products or services for financial reporting purposes. Increasingly, companies measure and manage the costs and profitability of their customers. Customer related costs include: Order processing Customer service sales commissions Dedicated customer support
General Framework for Cost Allocation An accounting system will assign to a department’s output all its direct costs plus all the indirect costs allocated to it. A cost driver that has a logical, cause-effect relationship to the cost will be used as a cost-allocation base
Establish the details regarding cost allocation in advance. 1 Allocate variable- and fixed- cost pools separately. 2 Evaluate performance using budgets for each production and service department. 3 Learning Objective 2 Allocation of Service Department Costs
School of Business School of Engineering Service Department Example 5-year lease Computer Department
Service Department Example Suppose there are two major purposes for the allocation: Predicting economic effects of the use of the computer Motivating departments and individuals to use its capabilities more fully
Service Department Example The primary activity performed is computer processing. Resources consumed include 1. Processing time 2. Operator time 3. Consulting time 4. Energy 5. Materials 6. Building space The budget formula for the forthcoming year is £100,000 monthly fixed cost plus £200 variable cost per hour of computer time used.
Variable-Cost Pool The cost driver for the variable-cost pool is Actual hours of computer time used. Therefore, variable costs should be allocated as follows: Budgeted unit rate XActual hours of computer time used
Variable-Cost Pool Consider the allocation of variable costs to a department that uses 600 hours of computer time. 600 hours × £200 = £120,000 Suppose inefficiencies in the computer department caused the variable costs to be £140,000 instead of £120,000.
Variable-Cost Pool A good cost-allocation scheme would allocate only the £120,000 to the consuming department and would let the £20,000 remain as an unallocated unfavorable budget variance of the computer department. This scheme holds computer department managers responsible for the £20,000 and reduces the resentment of user managers.
Fixed-Cost Pool The cost driver for the fixed-cost pool is the amount of capacity required when the computer facilities were acquired. Fixed costs should be allocated as follows: Budgeted percent of capacityavailable for use × Total budgeted fixed costs
Fixed-Cost Pool Suppose the deans had originally predicted the long-run average monthly usage as follows: School of Business: 210 hours School of Engineering: 490 hours How is the fixed-cost pool allocated? Business: 210 ÷ 700 = 30% £100,000 X .3 = £30,000 Engineering: 490 ÷ 700 = 70% £100,000 X .7 = £70,000
Fixed-Cost Pool This predetermined lump-sum approach is based on the long-run capacity available to the user, regardless of actual usage from month to month. A major strength of using capacity available rather than capacity used when allocating budgeted fixed costs is that actual usage by user departments does not affect the short-run allocations to other user departments.
Reciprocal Services Service departments often support other service departments in addition to production departments. There are two popular methods for allocating service department costs: The direct method The step-down method
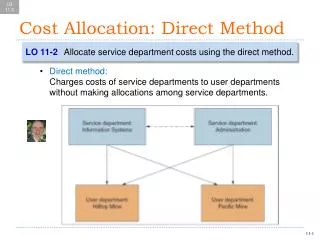
Learning Objective 3 Direct and Step-Down Methods The direct method ignores other service departments when any given service department’s costs are allocated to the revenue-producing (operating) departments. The step-down method recognizes that some service departments support the activities in other service departments as well as those in production departments.
Direct and Step-Down Methods Facilities management cost = £1,260,000 Human resources cost = £240,000 Total square footage in production departments: 15,000 processing + 3,000 assembly = 18,000 Total employees in production departments 16 processing + 64 assembly = 80 Square footage in human resources = 9,000
Direct Method Facilities management cost allocated to processing = (15,000 ÷ 18,000) × £1,260,000 = £1,050,000 Facilities management cost allocated to assembly = (3,000 ÷ 18,000) × £1,260,000 = £210,000
Direct Method Human resources cost allocated to processing = (16 ÷ 80) × £240,000 = £48,000 Human resources cost allocated to assembly = (64 ÷ 80) × £240,000 = £192,000
Step-Down Method Facilities management allocation: To human resources: (9 ÷ 27) × £1,260,000 = £420,000 To processing: (15 ÷ 27) × £1,260,000 = £700,000 To assembly: (3 ÷ 27) × £1,260,000 = £140,000
Step-Down Method Human resources allocation: £240,000 + £420,000 = £660,000 To processing: (16 ÷ 80) × £660,000 = £132,000 To assembly: (64 ÷ 80) × £660,000 = £528,000
Step-Down Method Processing department Direct Step-Down Direct department costs £1,000,000£1,000,000 From facilities management 1,050,00 700,000 From Personnel 48,000 132,000 Total costs £2,098,000£1,832,000
Step-Down Method Assembly department Direct Step-Down Direct department costs £1,600,000£1,600,000 From facilities management 210,000 140,000 From personnel 192,000 528,000 Total costs £2,002,000£2,268,000
Identify additional cost drivers. 1 Allocate all costs by the direct or step-down method using square footage as the cost- allocation base. 2 Costs Not Related to Cost Drivers Guidelines:
Direct costs Indirect costs Learning Objective 4 Traditional Approach 1. Divide the costs in each producing departments. 2. Assign direct costs to the appropriate products, services, or customers.
Cost pool Cost pool Cost pool Traditional Approach 3. Select one or more cost pools and related cost drivers in each production department. Indirect departmental costs
Product A Product B Product C Traditional Approach 4. Allocate costs Costs
Step 1: Determine the key components of the system. Step 2: Develop the relationships among resources, activities, and cost objectives. Activity-Based Costing
Step 4: Calculate and interpret the new activity-based cost information. Activity-Based Costing Step 3: Collect relevant data concerning costs and the physical flow of the cost-driver units among resources and activities.
Allocation of Customer Costs Learning Objective 5 Allocate costs associated with customer actions to customers. Customer profitability depends on more than gross margin, it depends on the costs incurred to fulfill customer orders and to provide other customer services.
Allocation of Customer Costs Customer Type 1 Customer Type 2 High Cost to Serve Low Cost to Serve • Large order quantity • Few order changes • Little pre- and post-sales support • Regular scheduling • Standard delivery • Few returns • Small order quantity • Many order changes • Large amounts of pre- and post-sales support • Expedited scheduling • Special delivery requirements • Frequent returns
Allocation of Customer Costs Customer Type 1 Customer Type 2 High Cost to Serve Low Cost to Serve • Buys a mix of products that have high gross margins • Has a low cost-to-serve % • Has a high level of profitability • Buys a mix of products that have lower gross margins • Has a high cost-to-serve % • Has a low level of profitability
Allocation of Customer Costs Assume Cedar City Distributors (CCD), distributes many products to retail outlets. The products are classified into just two product groups – apparel and sports gear. • CCD has two types of customers: • Small store • Large store
Allocation of Customer Costs CCD uses a simple cost accounting system to calculate both product and customer profitability. The only direct costs are costs of the purchase of apparel and sports gear products. Indirect costs are allocated to the product groups using a single indirect cost pool for all indirect costs with “pounds of product” as the allocation base. Costs
Allocation of Customer Costs To determine customer profitability: 1. Calculate the profit margin per case for each product Use the product mix ordered by each customer to calculate profitability Small StoresLarge Stores Cases Profit Margin Total Cases Profit Margin Total per case Profit Margin per case Profit Margin Apparel 600 £265.00 £159,000 800 £265.00 £212,000 Sports Gear 200 315.00 63,000 800 315.00 252,000 222,000 464,000 Profit Margin Percentage 43.7% 41.4%
Allocation of Costs-to-Serve Might number of customer orders be a more plausible cost-allocation base? The cost of resources used for order processing and customer service activities should be included in a separate cost pool and allocated on the basis of number of orders. This system gives managers at CCD more insight into operations, and a tool to measure and manage customer profitability.
Learning Objective 6 Allocation of Central Costs Many managers believe it is desirable to fully allocate all costs to the revenue- producing parts of the organization. Whenever possible, the preferred driver for central services is usage. If a company does allocate the costs of central services based on sales, although costs do not vary in proportion to sales, it should use budgeted, not actual, sales.
Not always economically viable Allocation of Central Costs Usage Revenue Total assets Cost of goods sold Total cost of each division
Learning Objective 7 Allocation of Joint Costs Two conventional ways of allocating joint costs to products are widely used: Physical units Relative sales values Joint costs include all inputs of material, labor, and overhead costs that are incurred before the split-off point.
Allocation of Joint Costs The physical-units method requires a common physical unit for measuring the output of each product. The joint costs are allocated based on each product’s percentage of the total physical units produced. Allocation of joint costs should not affect decisions about the individual products.
Physical-Units Method Dow Chemical produces two chemicals, X and Y. The joint cost is £100,000. X sells for £.09 per liter and Y for £.06. Allocation Sales Value at Liters Weighting of Joint Costs Split-off Point X 1,000,000 (10/15)X£100,000 £ 66,667 £ 90,000 Y 500,000 (5/15)X£100,000 33,33330,000 1,500,000 100,000 120,000
Relative-Sales-Value Method The joint costs are allocated based on each product’s sales value as a percentage of the total sales value at split-off.
Relative-Sales-Value Method When weighting is based on the sales value of the individual products, the allocation of a cost to one product depends upon the sales value of both products. Relative Sales Value at Allocation Spit-off Point Weighting of Joint Costs X £ 90,000 (90/120)X£100,000 £ 75,000 Y 30,000 (30/120X£100,000 25,000 £120,000 £100,000