Making Work Zones Work Better
180 likes | 374 Views
Making Work Zones Work Better. Talking Freight Seminar June 20, 2006. Chung Eng Work Zone Mobility & Safety Team Office of Transportation Operations Federal Highway Administration US Department of Transportation. Agenda. What Do We Know? What Can Be Done? What is FHWA Doing?.

Making Work Zones Work Better
E N D
Presentation Transcript
Making Work Zones Work Better Talking Freight Seminar June 20, 2006 Chung Eng Work Zone Mobility & Safety Team Office of Transportation Operations Federal Highway Administration US Department of Transportation
Agenda • What Do We Know? • What Can Be Done? • What is FHWA Doing? Work Zones:
Work Zones – What We Know: • Our highway infrastructure is aging • Construction work is increasing • Growth in VMT is outpacing the addition of new lane miles • Congestion is growing
1983 100 2003 80 60 Hours 40 20 0 Atlanta Miami Detroit Boston Phoenix Average Chicago Dallas Houston New York Washington San Francisco Philadelphia LA/Long Beach City Growth in Wasted Hours • Congestion has increased dramatically over the past 2 decades. • In the 13 largest cities, drivers spend the equivalent of almost eight work days each year stuck in traffic. • Work Zones account for 10% of overall congestion. Annual Hours Lost to Congestion Per Peak Hour Driver Very Large Metro Areas, 1983 v. 2003 Source: Texas Transportation Institute, 2005 Urban Mobility Report
Cost of Congestion to U.S. Businesses Portland General Electric estimates that itspends around $500K/year for additional travel time for maintenance crewsdue to congestion. In 2000, congestion at the Ambassador Bridge between Detroit, Michigan and Windsor,cost motor carriers between $150M and $200M. Intel hasmoved their last shipment departure time up two hours for outbound shipments through PDXdue to increased pm peak congestion. Atlanta area distributor of pet food with an 11-truck fleet finds itdifficult for one truck to make more than 12 daily deliveries; in 1984, one truck made as many as 20 deliveries each day.
Work Zones – What We Know: • Our highway infrastructure is aging • Construction work is increasing • Growth in VMT is outpacing the addition of new lane miles • Congestion is growing • Crashes are increasing
Work Zones – What We Know:Crashes are Increasing According to a Federal Motor Carrier Safety Administration analysis, approximately 25% of work zone fatal crashes in 2005 involved a large truck.
What Can Be Done? • To reduce work zone delay • To reduce crashes, fatalities, and injuries?
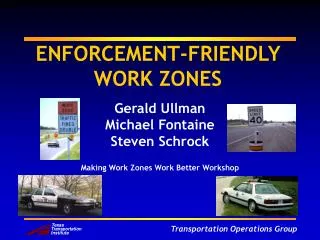
What Can be Done to Make Work Zones Work Better? • Recognize impacts early and develop projects to include strategies that minimize impacts • Look for ways to reduce exposure: • Reduce number work zones • Reduce duration of work zones • Work during off-peak periods • Consider full closures as appropriate • Provide information to drivers • Reduce hazards in work zones
What is FHWA doing? • Issued Work Zone Safety and Mobility Rule • Identifying & promoting best practices • Providing training • Providing guidance • Providing technical assistance and facilitating information sharing
WZ Safety and Mobility Rule • Published Sept 2004 – Compliance by Oct 2007 • Major Provisions • Develop & Implement a WZ Policy • Implement Processes and Procedures to Support the Policy - WZ impacts assessment & management - Training - Use of safety & operational data - Process reviews • Implement Project Procedures - Identify significant projects - Develop transportation management plans (TMPs)
WZ Safety and Mobility Rule • What We Expect to See • More focus on system impacts versus individual WZ site impacts • WZs impacts considered throughout project delivery process • More WZ training • More effective communication with the public • Safer WZs • More performance monitoring and assessment
Work Zone Best Practices • Best Practices Guide • Case Studies • Fact Sheets
Training • New NHI Course – Advanced Work Zone Management • Work Zone Law Enforcement Training • WZ Safety and Awareness Program for New Drivers • Quick Zone Training • Work Zone Safety Grants – Development of Training & Guidance
Guidance • Implementing the Rule on WZ Safety & Mobility • WZ Public Information & Outreach Strategies • Developing & Implementing TMPs for Work Zones • WZ Impacts Assessment
Technical Assistance • Work Zone Peer-to-Peer Program (WZ P2P) – Provides short-term assistance in the application of methods, tools, and strategies to improve WZ safety and mobility.
For More Information . . . • Chung Eng, FHWA Work Zone Team Leader, chung.eng@fhwa.dot.gov • Tracy Scriba, FHWA Work Zone Team tracy.scriba@fhwa.dot.gov • FHWA Work Zone Website, http://www.fhwa.dot.gov/workzones