Download

1 / 13
130 likes | 204 Views
Learn how to collect, organize, and analyze statistical data using various graphs and measures of center to draw meaningful conclusions from data. Explore the difference between census and sampling methods, as well as recognizing bias in data collection. Practice organizing data and analyzing biases to draw accurate conclusions.

E N D
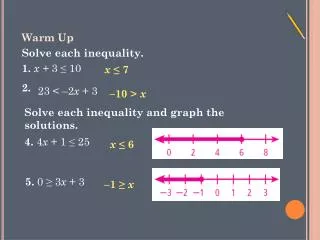
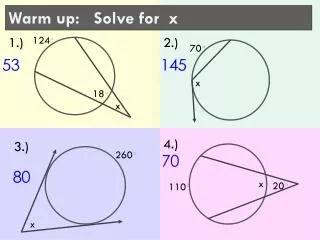
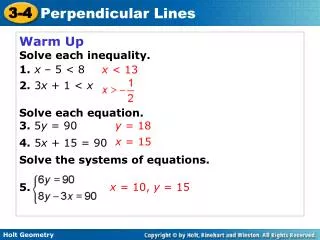
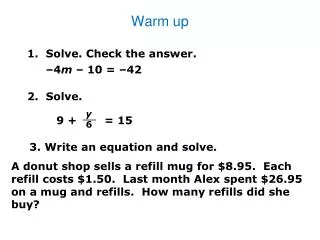
Warm Up Sept 16 • Solve • 3 – x = - 4 • 3x – 7 = 5 • 3(x + 7) = -10 • 3(h – 2) + 15 = 18
Lesson 4.1: Organizing and Displaying Data (Introduction to Data Analysis) When we analyze data, we can see how individual pieces of information can contribute to a larger meaning. Just like in Robert Silvers photo collage below.
By the end of this chapter you will be able to: • Collect statistical data and organize it • Make sense of your data via different types of graphs and measures of center • Analyze the strengths and weaknesses of each kind of graph and measure of center to determine which one provides the best representation of data based on the situation • State a conclusion about your data based on your organization and analyzing of data
Collecting Data: There are 2 types of data collection. Census – surveys the entire population. Sample – surveys a small portion or subset of the population Examples: • Census • 1. Asking all the 9th graders at PHS what their favorite subject in school is. • Sample • 2. Asking 10 students in Mr. Castillo’s 6th hour math class what their favorite subject is.
You try these: • 1. The cafeteria asked 50 students what should be served for lunch. • Sample • 2. All the residents of San Tan Ranch neighborhood were surveyed to determine their opinions about a new road planned to run thru their park. • Census
Why we use sampling vs. census. • Usually impossible to get data from an entire population. • Cheaper • Takes less time.
Random vs. Bias • Random Sample– every person in population has an equal chance of being selected. • Bias – is not random and it favors certain outcomes Examples: • 1. You want to find out the favorite sport of high school students. You ask only the girls volleyball team. • Biased • 2. You ask those coming out of Fry’s what their favorite grocery store is. • Biased
3. A survey asks a random group of high school students what their favorite music is. • Random • 4. Every 10th student is selected and asked what could improve school lunch. • Random
Use the data table to organize results: List the states from greatest to least for money spent on Emergency: List the damage category in order by total from least to greatest:
Answers: Missouri, Iowa, Illinois, Minnesota, Kansas, South Dakota, North Dakota, Wisconsin, Nebraska Agricultural, Other, Emergency, Utilities Are these measures a sample or a census?
Summary Why are these biased? • 1. Police officer in a uniform asks people how many times they have used drugs. • 2. Asking math teachers about their attitude towards standardized math tests.
Thinking about our data: • What could you conclude from our data? • Is the table above a census or a sample? • Is it biased or random (unbiased)? • How could we bias our data, if we wanted to say that the heart rates of students at Perry are higher than students at other high schools?