PRODUCT PURIFICATION PRECIPITATION
610 likes | 1.41k Views
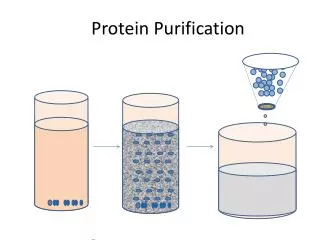
PRODUCT PURIFICATION PRECIPITATION. ERT320 BIOSEPARATION ENGINEERING MISS WAN KHAIRUNNISA BINTI WAN RAMLI. INTRODUCTION. I nvolves the conversion of soluble solutes into insoluble solids, which can be separated subsequently from liquid by physical separation methods R ecovery of bulk protein

PRODUCT PURIFICATION PRECIPITATION
E N D
Presentation Transcript
PRODUCT PURIFICATIONPRECIPITATION ERT320 BIOSEPARATION ENGINEERING MISS WAN KHAIRUNNISA BINTI WAN RAMLI
INTRODUCTION • Involves the conversion of soluble solutes into insoluble solids, which can be separated subsequently from liquid by physical separation methods • Recovery of bulk protein • Preliminary stages of downstream processing • Induced by: salt/ organic solvent addition, changing of ph value to alter the nature of the solution • ADVANTAGES relatively inexpensive,simpler equipment, continuous process, formation of protein that is often stable in long-term storage
PROTEIN SOLUBILITY • PROTEINS PRECIPITATE AS A RESULT OF INSOLUBILITY. • PROTEIN SOLUBILITY IS DETERMINED BY THE INTERACTIONS BETWEEN SURFACE REGIONS WITH SURROUNDING WATER MOLECULES. • SEVERAL FACTORS AFFECTING THE PROTEIN SOLUBILITY ARE CONSIDERED IMPORTANT: • STRUCTURE & SIZE, CHARGE, SOLVENT
FACTORS AFFECTING PROTEIN SOLUBILITY • STRUCTURE & SIZE • In the native state, a protein in an aqueous environment assumes a structure that • MINIMIZES the contact of the hydrophobic amino acid residues with the water solvent molecules • MAXIMIZES the contact of the polar and charged residues with the water. • CHARGE • The net charge of a protein has a direct bearing upon the protein’s solubility. • The solubility of a protein increases as its net charge increases, a result of greater interaction with dipolar water molecules. • SOLVENT • The solvent affects the solubility of proteins primarily through two parameters: • HYDROPHOBICITYand IONIC STRENGTH
STRUCTURE & SIZE • The major forces to stabilize a protein in its native state hydrogen bonding, van derWaals interactions, Solvophobic interactions (driven forces of folding protein). • In aqueous solution, these forces tend to push • 1) hydrophobic residues into the interior of the protein, • 2) the polar and charged residues on the protein’s surface. • the surface of proteins usually contains a significant fraction of non polar atoms. The forces acting on a protein lead to the achievement of a minimum (small) Gibbs free energynative protein only marginally stable and can be destabilized by relatively small environmental changes • Water molecules bind to the surface of the protein molecule because of association of charged and polar groups and immobilization by nonpolar groups. • These hydration layers are thought to promote solubility of the protein by maintaining a distance between the surfaces of protein molecules (figure 1)
CHARGE • The solubility of protein increased as its net charge increases as a result of greater interaction with h2o molecules. • A repulsive reaction between protein molecules of same charge further increases solubility. • A simple way to vary the charge on a protein is by ph alterations. • Isoelectric pH/ isoelectric pointpH of the solution in which a protein has zero net charge • Figure 3The solubility of a protein is at its minimum, at the isoelectric point. • Figure 3 The solubility (S) of insulin in 0.1 N NaCI as a function of pH. The charge Z is the average protonic charge per 12,000 g of insulin at the pH values indicated. At Charge, Z = 0, S = Smin
SOLVENT PARAMETERS OF SOLVENT AFFECTS • HYDROPHOBICITY • SINGLE-PHASE SOLUTIONS OF H2O & MONOHYDRIC ALCOHOLS DENATURATION AT ROOM T, CAN BE AVOIDED AT LOW T • DENATURING EFFICIENCYC1-OH<C2-OH<C3-OH<C4-OH • LONGER ALKYL CHAIN OF ALCOHOLS> EFFECTIVE BINDING TO POLAR GROUPS, WEAKENED INTRAPROTEIN HYDROPHOBIC INTERACTIONS DENATURATION • When the temperature is low, the monohydric alcohols compete for the water of hydration on the protein and cause the protein molecules to approach more closely, so that van der Waals interactions lead to aggregation. • IONIC STRENGTH • CAN HAVE BOTH EFFECTS SOLUBILIZING (SALTING IN) & PRECIPITATING (SALTING OUT) EFFETCS • SALTING INTHE ADDITION OF SMALL QUANTITIES OF NEUTRAL SALTS TO A PROTEIN SOLUTION WHICH OFTEN INCREASES PROTEIN SOLUBILITY • SALTING OUTADDITION OF SALTS ABOVE AN OPTIMAL LEVEL WHICH LEADS TO DESTABILIZATION OF PROTEINSIN SOLUTION & EVENTUALLY PROMOTES PROTEIN PRECIPITATION
Kirkwood’s theory for salting-in effectsthe interactions between ions & dipoles is by considering the solute size, solute shape, solute dipole moment, solvent dielectric constant, solution ionic strength, and temperature. • where Sp = the solubility of the dipolar ion at ionic strength I, • So= the solubility of the dipolar ion in the absence of salt, • Ki= the salting-in constant, Ks = the salting-out constant. • Ionic strength is defined by • where ci, = Molar concentration of any ion in salt and zi = Ion’s charge. • The salting-in and salting-out constants can be related to other variables as follows: • where ε = the dielectric constant of the solvent, T = temperature, • Ve= the excluded volume of the dipolar ion, u = dipole moment (C cm) E3 E4 E5 E6
KIRKWOOD’S MODEL PROVES • PROTEINS WITH HIGHER DIPOLE MOMENT HAVE GREATER SALTING-IN EFFECT • The salting-in term increases more than the salting-out term as the dielectric constant decreases AS A RESULT OF THE DECREASED SOLVENT POLARITY • the salting-in effect tends to predominate in relatively nonpolar solvents, while the salting-out effect is more dominant in aqueous solvents. • At high ionic strength, the salting-out effect becomes predominant and can be described empirically by the Cohn equation • Where S= protein solubility, • Ks’=salting-out constant characteristic of the specific protein and salt that is independent of temperature and pH above the isoelectric point. • β= The hypothetical solubility of the protein at zero ionic strength, depends only on temperature and pH for a given protein and is a minimum at the isoelectric point E7
The Kirkwood equation for the solubility of dipolar ions [E3] can be arranged to give: • which is also identical in form to the Cohn equation, with • Figure 4From zero ionic strength, the solubilityof the protein increases to a maximum as salt is added (salting in) and then continuously decreases as even more salt is added (salting out). E8 E10 E9 Salting in Salting out • Figure 4The effect of (NH4)2SO4 and Na2SO4 on the solubility of hemoglobin: S0 is the solubility in pure water, S is solubility in salt solution
EXAMPLE 1 SALTING OUT OF A PROTEIN WITH AMMONIUM SULFATE Data were obtained on the precipitation of a protein by the addition of ammonium sulfate. The initial concentration of the protein was 15 g/liter. At ammonium sulfate concentrations of 0.5 and 1.0 M, the concentrations of the protein remaining in the mother liquor at equilibrium were 13.5 and 5 g/liter, respectively. From this information, estimate the ammonium sulfate concentration to give 95% recovery of the protein as precipitate.
We can use the Cohn equation [E3], to solve this problem if we can determine the constants in the equation. Since ionic strength is directly proportional to concentration, c for a given salt [E4], we can rewrite the Cohn equation as Substituting the experimental data into this equation gives Solving these equations for the constants yields For 95% recovery, the protein solubility in the mother liquor at equilibrium is 5% of the initial protein concentration. At this solubility, from the Cohn equation
PRECIPITATION FORMATION PHENOMENA • MECHANICAL STRENGTH • LOWmechanical strength problem with excessive attrition when the dry particles are moved & considered as gel formation, which leads to major problems in filtration and centrifugation IMPORTANT CHARACTERISTICS • PARTICLE SIZE DISTRIBUTION • Protein precipitates that consist largely of particle sizes with small particles (~1µm) can be difficult to filter or centrifuge • DENSITY • LOW particle densities filtration or centrifugation problems and can give excessive bulk volumes of the final dried precipitate Particle breakage during mixing limits the final size of the precipitate particles PRECIPITATE FORMATION STEPS particles are mixed until reaching a stable size
INITIAL MIXING • INITIALMIXINGThe mixing required to achieve homogenity after the addition of a component to cause precipitation • CRUCIALto bring precipitant and product molecules into collision as soon as possible • Mixing between randomly dispersed eddies is instantaneous & the mixing within eddies is diffusion limited • Mean length of eddies, also known as the “Kolmogoroff length”, le • where ρ = the liquid density, ν = the liquid kinematic viscosity, • P/V = the agitator power input per unit volume of liquid E11
It is necessary to mix until all molecules have diffused across all eddies. This time can be estimated from the Einstein diffusion relationship • where δ is the diffusion distance and D is the diffusion coefficient for the molecule being mixed. • For spherical eddies of diameter le, this becomes • Thus,precipitation is initiated in a well-stirred tank for a period of time determined on the basis of isotropic turbulence. • ISOTROPIC TURBULENCE Turbulence in which the products and squares of the velocity components and their derivatives are independent of direction or invariant with respect to rotation and reflection of the coordinate axes in a coordinate system moving with the mean motion of the fluid. E13 E12
NUCLEATION • NUCLEATION Particles Generationof ultramicroscopic size • For the particles of a given solute to form, the solution must be SUPERSATURATED of solute component, with the intention that the concentration of the solute in solution > the normal equilibrium solubility of the solute • DEGREE OF SUPERSATURATIONThe difference between the actual concentration in solution and the equilibrium solubility • NEGATIVE EFFECTS of high supersaturation The precipitate tends to be in the form of a colloid, a gel, or a highly solvated precipitate • To obtain precipitate particles having desirable characteristics, the supersaturation should be kept relatively low
Figure 5: Nucleation rate as a function of degree of supersaturation. The normal equilibrium solubility is at A and the supersaturation limit is at B • FIGURE 5 RATE OF NUCLEATION increases exponentially up to the maximum level of supersaturation/ supersaturation limit. • The rate of nucleation increases to a very high value at the supersaturation limit.
GROWTH GOVERNED BY DIFFUSION E16 • After NUCLEATION, precipitate growth is limited by diffusion until the particles grow to a limiting particle size defined by the fluid motion. • When dissolved solute diffuses to the particles, the initial rate of decrease of particle number concentration (N) can be described by a second-order rate equation (Smoluchowski): • For convenience, N0 is taken as the initial number concentration of dissolved solute molecules • The constant KA is determined by diffusivity D and diameter Lmol, of the molecules that are adding to the particles as follows: E14 E15
EQ. (16) can be rewritten as • with M as the MW of particles at time t and M0 as the MW of the solute • so that • This equation has been verified experimentally by • measuring the MW of precipitating α–casein (FIGURE 6) • The Stokes-Einstein equation Estimate the diameter of globular proteins, as spheres: • where k is the Boltzman constant, T is the absolute temperature and μ is the liquid viscosity E19 E20 E17 E18
GROWTH GOVERNED BY FLUID MOTION • The growth of particles is governed by fluid motion after the particles have reached a critical size, typically 1μm in diameter • In this growth regime, particles tend to grow by colliding and then sticking together FLOCCULATION process • Flocculation is enhanced when electrostatic repulsion between particles is reduced in comparison to the attractive van der Waals Force • Can be accomplished by raising the ionic strength and lowering the temperature, to reduce the thickness of the electrical double layer or Debye length, around particles.
The initial rate of decrease of particle number concentration (N) due to collisions can be described by a second-order rate equation: • α = the collision effectiveness factor (fraction of collisions that result in permanent aggregates) • L = the diameter of the particles and γ = the shear rate (velocity gradient) • Assuming that the volume fraction of the particles (ф = πL3N/6) is constant during particle growth governed by fluid motion, EQ (21) becomes; E22 E21
Integrating EQ. (22) yields • Where N0 = The particle number concentration at the time [t=0] in at which particle growth starts to be governed by fluid motion • For turbulent flow, the average shear rate can be estimated by the following equation developed by Camp and Stein: • where P/V = Power dissipated per unit volume and ρ and ν are the density and kinematic viscosity of the liquid, respectively E23 E24
PRECIPITATE BREAKAGE • When precipitate particles grow large enough by colliding and sticking together, they become susceptible to breakage during collisions • The rate of precipitate breakage depend on the shear rate and particle concentration • A model that has successfully described the breakup of protein precipitates: The displacement model, which depicts the rate of aggregate size change as a function of displacement from an equilibrium aggregate diameter, Le: • where the rate constant k would be expected to depend on the volume fraction of particles ф and the shear rate γ E25
The equilibrium diameter Le depend on the shear rate • For soy protein precipitate in laminar Couette shear • 2000s-1≤ γ ≤ 80,000s-1 • And for casein precipitated by salting out in continuous stirred tank reactor • 12s-1≤ ≤ 154s-1 • = the equilibrium particle size at the volume mean of the • particle size distribution E26 E27
PRECIPITATE AGING • FIGURE 7Protein precipitate particles reach a stable size after a certain length of time in a shear fieldAGING time
Camp number The strength of protein particles correlated with the product of the mean shear rate and aging time. • FIGURE 8 soy protein particles: the mean particle size becomes approximately constant after reaching a Camp number of 105 • Aging of precipitates helps the particles withstand processing in pumps and centrifuge feed zones without further size reduction
METHODS OF PRECIPITATION ADDITION OF ORGANIC SOLVENTS ISOELECTRIC PRECIPITATION METHODS OF PROTEIN PRECIPITATION ADDITION OF SALT ADDITION OF NONIONIC POLYMERS
ISOELECTRIC PRECIPITATION • BASIS OF SEPARATION the solubility of a given protein is generally at a minimum at the isoelectric point (pI) of the protein. • A convenient method when fractionating a protein mixture. • The pH should be adjusted above the highest pI or below the lowest pI of all the proteins present. • The pH is then changed to the nearest pI where precipitate is allowed to form and is then removed. • ADVANTAGES when acids are added to cause precipitation: mineral acids are CHEAP, and several acids (e.g., phosphoric, hydrochloric, sulfuric) are acceptable in protein food products. • NOT for all proteins Gelatin, which is a very hydrophilic protein, does not precipitate at its isoelectric point in solvents with low ionic strength
ADDITION OF ORGANIC SOLVENT • Several organic solvents have been used to precipitate proteins, including alcohols, acetone, and ether. • Alcohols - the most widely used in industry. • Cohn Process One of the most important processes utilizing alcohol to precipitate protein to purify therapeutic proteins from human plasma. • Uses ethanol at temperatures below 0°C to minimize denaturation by the organic solvent. • Manipulated variables: pH, ionic strength, and ethanol concentration. • Ionic strength is kept low, which leads to a salting-in effect • The salting-in effect is enhanced when ethanol is added.
ADDITION OF SALT • SALTING OUT Salt is dissolved in the solution containing the proteins. The protein solubility decreases as the salt ionic strength rises (Cohn equation) • IMPORTANT CONSIDERATION in salting out The type of salt that is used. • Salts with multiply charged anions Sulfate, phosphate, and citrate • Cation monovalent ions • Following the Hofmeister or lyotropic series, the salting-out ability of the common multiply charged anions • citrate2- > phosphate3- > sulfate2- ; • for the common monovalentcations the order is • NH4+ > K+ > Na+ • DESIRABLE SALT for precipitating proteins ammonium sulfate.
ADVANTAGES OF AMMONIUM SULFATE • Its solubility is very high (approximately 4 M in pure water) and varies very little in the range of 00 to 300C. • The density of its saturated solution is 1.235 gcm-3 , enough below the density of protein aggregates (approximately 1.29 gcm-3 ) to allow centrifugation. • Protein precipitates are often very stable for years in 2 to 3 M salt • Proteolysis and bacterial action are prevented in concentrated ammonium sulfate solutions. • The only DISADVANTAGES: Cannot be used above pH 8 because of the buffering action of ammonia. • Sodium citrate is very soluble and is a good alternative to ammonium sulfate when the precipitation must be performed above pH 8
ADDITION OF NONIONIC POLYMERS • Several nonionic polymers have been used to precipitate proteins, including dextran, poly(vinyl pyrrolidone) (PVP), poly(propylene glycol), and poly(ethylene glycol) (PEG) • Of these polymers, by far the most extensively studied is PEG. • POLYETHELYNE GLYCOL [PGE]: • Solutions of PEG up to 20% w/v can be used without viscosity becoming a problem. • PEG’s with molecular weights above 4000 - found to be the most effective • Protein destabilization in PEG solutions does not occur until the temperature is significantly higher than room temperature (>40 0C)
DESIGN OF PRECIPITATION SYSTEM • The safest procedure is to base on the design on a lab or pilot plant system that has given acceptable results • Important consideration in obtaining the best possible plant design: • The type of precipitation reactor, • Processing conditions (flow rates, concentration etc.) • Assumption used to scale up to the plant scale BATCH PRECIPITATION REACTOR CONTINUOUS-STIRRED TANK TUBULAR
BATCH REACTOR • The simplest of the three types – tried first at small scale • Slowly adding the precipitating agent to a protein solution that is being mixed • Addition of the precipitating agent continues the desired level of supersaturation is reached with respect to the protein being precipitated • Nucleation begins, and precipitation proceeds through the steps of particle growth and aggregation • Mixing continues until the precipitation is complete - generally turbulent • Protein particles precipitated tend to be more compact and regular in shape than those precipitated in a tubular reactor, apparently because of the different shear profiles existing in the two reactors and the length of time the particles are exposed to this shear • The shear field in a tubular reactor – essentially homogeneous; by contrast in the batch reactor the precipitate particles are exposed to a very wide range of shears and to much longer times of exposure than in the tubular reactor, resulting in improved precipitate mechanical stability
TUBULAR REACTOR • Precipitation takes place in volume elements that approach plug flow as they move through the tube • The distance-particle size distribution history of the particles in a volume element moving through a tubular reactor is comparable to the time-particle size distribution history of a stationary volume element in a batch reactor • The feed protein solution and the precipitating agent are contacted in a zone of efficient mixing at the reactor inlet • The flow pattern in the reactor can be turbulent, a property that can be promoted by wire meshes at intervals along the reactor • Advantages: short fluid residence times, an absence of moving mechanical parts, uniformity of flow conditions throughout the reactor, a simple and inexpensive design and a relatively small holdup of fluid • For particles that grow relatively slow, the length of the tubular reactor can be excessive
CSTR • Fresh protein feed is contacted with a mixed slurry containing precipitate aggregates • The mixing conditions in a CSTR are similar to those in a batch rector • Upon entering the CSTR, fresh protein feed nucleates, the nucleate particles grow by diffusion and the submicrometer-sized “primary” particles collide with and adhere to growing aggregates • The degree of supersaturation can be more easily controlled than in the batch or tubular reactor which means tha not prone to form precipitates with undesirable properties
PROCESSING CONDITION • TURBULENT FLOW flow must be high enough to avoid inadequate mixing and high supersaturation but low enough to avoid excessive particle breakage leading to particles that are smaller than desirable • For both the batch and tubular reactors, the flow regime can be changed from turbulent to laminar during the particle growth phase to avoid excessive particle breakage • The rate of addition of precipitant should be kept low enough to avoid high supersaturations that lead to colloidal, highly solvated precipitates • The added concentrations of the precipitant with lower concentrations leading to lower supersaturation • KEY PARAMETER for scaleup of precipitation is MIXING: Recommended approach Consider using geometric similarity and constant power per unit volume (P/V).
If the precipitate is susceptible to shear breakage - the assumption of constant P/V for scale up may not be satisfactory • The impeller tip speed, which determines the max. shear rate, rises when P/V is held constant upon scale up of the reactor volume, as seen in table 1: • These results assume turbulent flow, where the power number is constant, so that Table 1: Scale-up of Turbulent Agitation, assuming constant P/V E28