An Investigation in Pattern Recognition
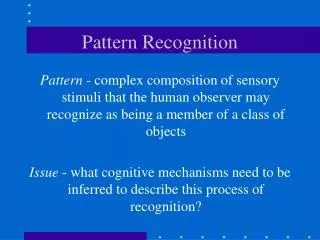
An Investigation in Pattern Recognition. Or, Why Can’t I Read My Statistics Notes?. Overview. How Do We Read?. More specifically, how does the brain recognize letters? Pattern Recognition How does pattern recognition in the brain work?

An Investigation in Pattern Recognition
E N D
Presentation Transcript
An Investigation in Pattern Recognition Or, Why Can’t I Read My Statistics Notes?
How Do We Read? • More specifically, how does the brain recognize letters? • Pattern Recognition • How does pattern recognition in the brain work? • Could a mathematical or computer model be built to emulate the way the brain recognizes letters?
Critical Point Theory • Critical point theory is the theory our group is testing • It states that brain recognizes how lines in letters intersect, and stores representations of these “critical points” • When you see a letter, your brain compares the critical points to stored critical point patterns to identify the letter
Major Questions • Is this theory valid? • If it is, how powerful is it? • Can we create a mathematical model that can be used to accurately predict how difficult it is to read a letter? • Aside from critical point theory parameters, what other parameters would be useful to have in such a model?
The Letter Sets • 50 letters were drawn using an image editor • Ten were control, and were normal letters • Ten had critical points covered by “paint” • Ten were covered by “paint,” but the critical points were left uncovered • Ten had the critical point relative orientation “bent” • Ten letters were bent, but the critical point relative orientation was unchanged
The Experiment • People were shown these letters, and asked to name the letters • Response time, in seconds, was recorded by the experimenter • They were told explicitly that they don’t need to mention the case of the letter • Sample Critically Occluded Letter
Data Divided into Two Analyses Occlusion Bend • Dependent Variable • Response Time • Explanatory Variables • Occlusion Type • Percent Occlusion • Frequency • Position • Points Occluded • Dependent Variable • Response Time • Explanatory Variable • Bend Type
Occlusion Set Analysis • Through ANOVA, it was found that occlusion type was indeed a significant predictor of response time • Through ANCOVA, it was shown that differences in occlusion percentage between occlusion types did not falsely suggest that the occlusion types were different • Through visual inspection and ANCOVA, it was shown that critically occluded points had overall higher reaction times than noncritically occluded points • A final model was derived through stepwise regression • Due to a lack of low occlusion percentage representation, occlusion percentage had an insignificant, negative “nonsense” coefficient, and was removed
Bend Set Analysis • Unfortunately, we couldn’t devise a method of quantifying how bent a letter is in comparison to an unbent version of the same letter. • Do you have any ideas as to how we could do this? • Through ANOVA it was shown that bend type was a significant factor in predicting response time
Results • It was demonstrated that our critical point theory has statistical support • Although the model created is poor, from the outset this study was intended to be an initial, exploratory study • The study suffered somewhat from lack of difference across administrations of the experiment • If this was to be followed up, it would benefit from computer-generation of unique experiments • Overall, the theory was demonstrated to show real evidence of validity. It is safe to call the study a success
The frequency data used in this experiment was taken from an online source. A formal citation is available upon written request to Jeff Cochran, and will be included in the Project Part II write-up.