StAR web server tutorial for ROC Analysis
An in-depth tutorial on using the StAR web server for ROC Analysis, allowing users to input data for multiple classifiers, plot and analyze ROC curves with customization options.

StAR web server tutorial for ROC Analysis
E N D
Presentation Transcript
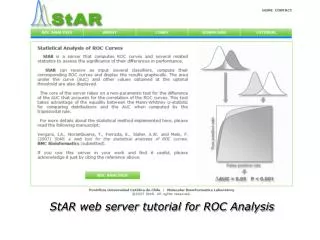
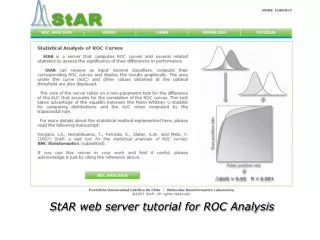
ROC Analysis: This module allows the user to input data for several classifiers to be tested. The user can start by clicking any of the two ROC Analysis buttons highlighted with a red box.
Job Name Input Data Options ROC Analysis Form. This is the form you must complete in order to proceed with the analysis. There are three main sections: Job Name, Input Data and Options.
ROC Analysis Form. Each section has online help with relevant details provided.
Job Name. The user can set a title for the job. This field is optional. In this case “Test Job” was chosen as job name.
Input Data. The user can upload data from his computer or paste it directly in the text area. The input data format is described in the help link.
Uploading files. As an example we will a small data set, containing 200 observations each file. Those can be downloaded from our server by clicking on the Download button. Also a larger data set is provided for you to test the server in the same section.
Uploading files. Click over the Browse button to select the file that will be uploaded. Try using the sample data sets available in our server (follow the download link). The user must be careful about the correct definition of the positive and negative data since the interpretation of results will depend on it.
Paste data. Positive and negative class data can be pasted on their respectives text areas. Each file should contain multicolumn data. Each column must be separated by tabs or blanks. The same column order should be present in both files. The data format is explained in detail by following the input data help link.
13,646 -1,330 13.646 -1.330 Uploading/Pasting data. Commas as decimal separator are also allowed for uploading/pasting data. The server will convert them to decimal points before proceeding with ROC analysis.
Options. The user can choose to plot an inverted ROC curve, if AUC values are smaller than 0.5. This is intended for a better comparison amongst ROC plots. Also, you can choose to display the MaximalAccuracy, false positive rate and true positive rate at an Optimal Threshold estimated by the server (Optimal Threshold is defined as the classification threshold that leads to the maximal accuracy). Finally, results can be sorted by descending AUC values (For sorting AUC values, inverted ROC curves are always used). All these options are selected by default.
Submit. The user is ready to submit the data to the server.
Output. Typical output of the StAR web server. Online help explaining the meaning of each column is obtained by left-clicking with the mouse over the column headers (surrounded by a red box). The user can select not to show those columns surrounded by a blue box.
Output. Typical output of the StAR web server. There are six actions the user can select to explore the results.
Output. The user can also select which classifiers are going to be plotted or analyzed. By default, all classifiers are selected.
Output. Those classifiers whose Area Under the Curve (AUC) are smaller than 0.5 have been reversed (that is AUC’ = 1 – AUC). They are pointed out by a plus sign in the Inverted column.
Plot/Update ROC curves. The user can plot the ROC curves for the selected classifiers by clicking on the highligthed button.
Plot/Update ROC curves. A new pop up window with the ROC plots will be displayed. The user can change several parameters to customize the plot.
Plot/Update ROC curves. Moving the mouse over the legend box will highlight the current classifier.
Changing the color of the ROC curves. Left-clicking over the current highlighted classifier will display a new window. The user can select the color by clicking any of the colored squares. Once the color is selected the window will be closed.
Changing the color of the ROC curves. The user must click the Update ROC Plot button to see the changes.
Deactivating options. The user can optionally select not to invert AUC values that are lesser than 0.5.
Deactivating options. True ROC curves are now plotted. Notice that AUC values are still inverted in the Summary Statistics section in order to perform the statistical analysis. This is intended to facilitate the comparison.
Deactivating options. The user can optionally select not to show parameters at Optimal Threshold value.
Deactivating options. Accuracy, true positives and false positives values are not shown.
Statistical Analysis I. A new pop up window will be displayed with a table containing the p-values of each pairwise comparison of classifiers. Comparisons where the differences are statistically significant at the selected p-value are shown in green color; otherwise the value is shown in red color. Significance level is set at 0.05 by default. For former users of this server, as of 2010 the Global p-value was removed from StAR.
Statistical Analysis I. The user can modify the significance level value by typing a new one directly on the text field. The Update button must be pushed in order to make changes effective.
Statistical Analysis II. A new pop up window will be displayed with a table containing the estimated covariance matrix.
Statistical Analysis III. A new pop up window displaying the confidence intervals for each pairwise comparison of classifiers at the selected significance level will be shown.
Statistical Analysis III. The modification of the significance level must be carried out in the section Statistical Analysis II, but it will be immediately effective for the calculation of confidence intervals of Statistical Analysis III.
Generate Report. The user can generate and download a simple report in PDF format (gzipped), which contains a summary of the results. This includes the ROC plots and summary statistics for the selected classifiers.
PDF Report. An example of the PDF report generated with StAR.
PDF Report. An example of the PDF report generated with StAR.
PDF Report. An example of the PDF report generated with StAR.
PDF Report. An example of the PDF report generated with StAR.
Download Results. The user can download a zipped file that contains the results from the analysis of the StAR server. All these files are in plain-text format, and contains the raw data and results. These files can be easily imported into other software for further analysis and visualization.
This is the end of the StAR web server tutorial for ROC Analysis Any comments or inquiries, please contact us.