Download
1 / 42
420 likes | 440 Views
Explore the origins and impact of salinity in Rio Grande through groundwater analysis. Discover salt distribution patterns, influence of wastewater, and respond to environmental changes. Dynamic modeling tools provide in-depth understanding of solute variability.

E N D
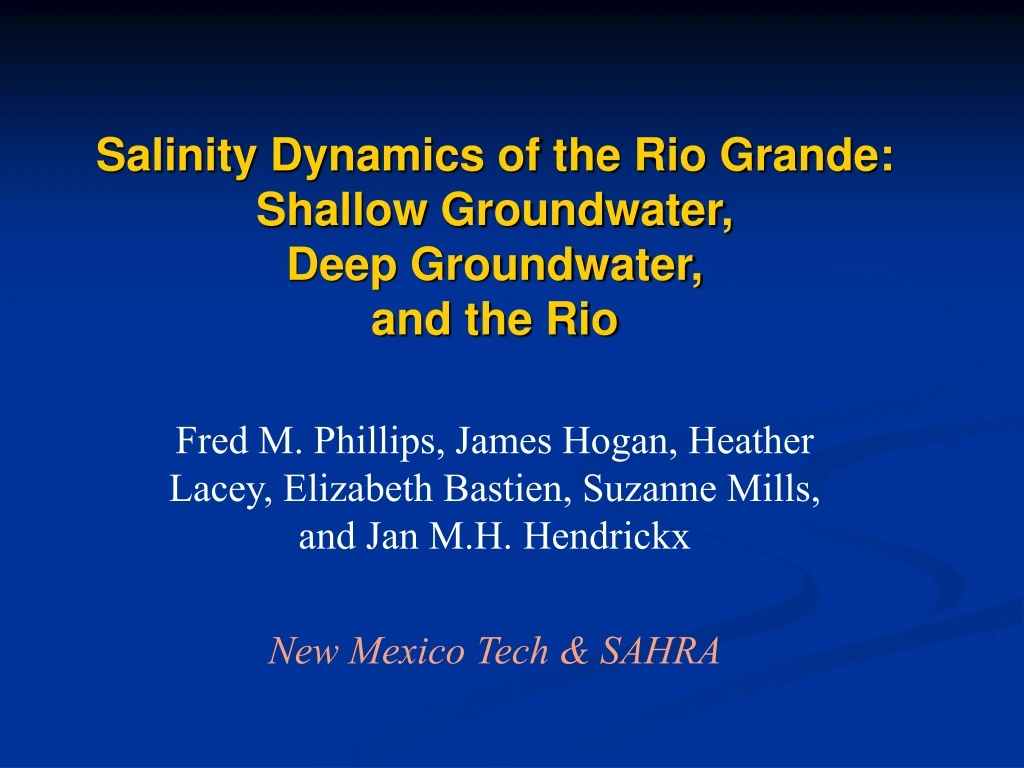
Salinity Dynamics of the Rio Grande: Shallow Groundwater,Deep Groundwater,and the Rio Fred M. Phillips, James Hogan, Heather Lacey, Elizabeth Bastien, Suzanne Mills, and Jan M.H. Hendrickx New Mexico Tech & SAHRA
Center for Sustainability of semi-Arid Hydrology and Riparian Areas(SAHRA)This research was funded by SAHRA under the Science & Technology Center Program of the U.S. National Science Foundation
Rio Grande basin = sedimentary basin • Basin Area - 32,210 mi2 • Precipitation - 6 to >50 in. • Population - 1,072,000 (1990) • Irrigation - 914,000 acres
Riparian Transpiration Open Water Evaporation Consumptive use Agricultural Evapotranspiration Geothermal waters Saline Groundwaters Salinity Sources Cyclic salts and Weathering Waste water
Causes of River Salinization? J.B. Lippincott (1939): “The increase in salinity of the waters of the Rio Grande [is] due to their use and re-use [for irrigation] in its long drainage basin...”
Wilcox (1957): “There is a relatively large increase in the tonnage of both sodium and chloride from the upper to the lower stations... [that can be] attributed to the displacement of salty groundwater in the course of irrigation and drainage operations.”
van Denburgh and Feth (1965): Noted that only 4.2% of the chloride burden of the Rio Grande originated from atmospheric deposition over the catchment and attributed the remainder to“continental solute erosion”.
How to Quantify Sources and Causes of Salinization? • Traditional approach: Measure discharge and salt concentrations at gaging stations and compute salt burden • Alternative Approach: Measure environmental tracers at high spatial resolution and employ dynamic simulation to interpret results
Chloride and Bromide – Mixing Relationships Mixing Sedimentary Brine Geothermal Meteoric Evaporation 1500 1000 Cl/Br 500 0 0 2000 4000 6000 8000 Cl (mg L-1)
Chlorine isotope and Chloride-Bromide mixing sedimentary brine Mixing meteoric Evaporation geothermal 1500 1000 Cl/Br (weight ratio) 500 0 0 200 400 600 800 1000 1200 1400 36Cl/1015 Cl
Patterns of Salt Addition:Chloride in the Rio Grande Ft. Quitman ~850 ppm
Patterns of Salt Addition cont’d:Cl/Br in the Rio Grande Ft. Quitman
Influence of drains Cl/Br Cl- (mg/L)
Saline input: San Acacia pool • [ Cl- ] = 32,300 mg L-1
Mixing Sedimentary Brine Rio Grande Evaporation 1500 1000 Cl/Br 500 Geothermal Meteoric 0 0 2000 4000 6000 8000 Cl (mg L-1)
sedimentary brine San Acacia pool Mixing line Rio Grande Evaporation geothermal 1500 1000 Cl/Br (weight ratio) 500 Rio Grande headwaters 0 0 500 1000 1500 2000 2500 3000 36Cl/1015 Cl
= basin terminus Points of Salt Addition Fraction Cl Added vs. flow distance Elephant Butte San Acacia El Paso Selden Canyon
= basin terminus Basin Groundwater Systems Schematic Hydrogeologic Cross-Section, Parallel to River Path river elevation
Location of high chloride waters Talon Newton
Drains pick up deep-basin salts Legend Rio Grande 1200 ppm Conveyance channel Socorro main canal/drain Luis Lopez drain 545 ppm 346 ppm 413 ppm TDS = 306 ppm; Cl = 30 ppm; Cl/Br = 306 Cl doubles; Cl/Br increases 30% TDS = 386 ppm; Cl = 66 ppm; Cl/Br = 376
Summary of Findings • Salt addition to the Rio Grande occurs in a stepwise pattern • Salt is added at San Acacia, Elephant Butte, Selden Canyon, and the El Paso narrows (and T or C)
Influence of wastewater • The Rio Rancho, Albuquerque, Las Cruces, and El Paso (Northwest WWTP) wastewater effluents all increase Cl- and Cl/Br in the river.
Where is salt going? Cl burden (kg/dy) Aug ‘01 Jan ‘02 Del Norte, CO = ag = seepage = tribs = wwtp Cochiti Elephant Butte Caballo Ft. Quitman • Inputs on left • Outputs on right • Pipe width • indicates burden • magnitude
Chloride concentrations and loads are highly variable in time and location We need a dynamic modeling tool to adequately understand budgets and variability of solutes in the Rio Grande
Powersim modeling - water model Inflow from Precipitation RGCC_SM Surface area of bank storage In volume Inflow from Inputs RS Head upstream SM BS Head Head gradient Rate_1 Pan coefficient Reservoir Storage Bank Storage Pan evaporation Surface Area Out Outputs Evaporation Coefficient for Release from conductivity and EBDam width of barrier
Powersim modeling - chloride model Inflow Cl from RGCC SM Cl In Inflow Cl from SM Euler Cl conc in BS Inflow Cl Euler Cl conc in RS Cl BS Rate_2 RS Cl Cl Bank Storage Cl RS Cl Output
Preliminary Results of Cl Modeling Taos Otowi
Chemical evolution of non-conservative solutes in the Rio Grande • In the 1950’s Wilcox found that • Cl- burden increased with distance down the river • Ca2+, Mg2+, and SO42- all decreased with flow distance • Implication is that Cl- is being added but that Ca and Mg carbonates and gypsum are precipitated during evaporation on irrigated fields
Field investigation of irrigation water-quality effects, near Lemitar • Coordinated sampling of irrigation water and groundwater through the irrigation season • Inspection for trends • Comparison of irrigation and groundwater quality • Geochemical processes explaining differences
Change in water quality during irrigation can be explained by • 35% evapotranspirative concentration • 1.5 mmoles/L of soil gas CO2 dissolved in the soil water • 0.75 mmoles/L of dolomite [CaMg(CO3)] dissolving • 0.45 mmoles/L of gypsum [CaSO4.2H2O] dissolving • Ion exchange of 0.325 mmoles/L of Ca2+ for 0.65 mmoles of Na+
Result • Geochemical trends opposite of what was hypothesized • Ca and Mg carbonates and gypsum are being dissolved • Possibly, if field site were further down-river, opposite trend would be observed? • Possibly Ca and Mg are being sequestered elsewhere in the river system?
Continuing work • Completion of PowerSim model of chloride dynamics • Quantification of solute inputs from deep groundwater sources • Continuing investigation of geochemical impacts of irrigation • Quantification of budgets and dynamics of all major solutes in the Rio Grande