Download
1 / 30
300 likes | 319 Views
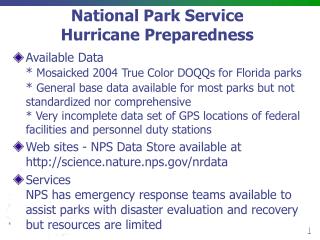
Learn about the National Park Service's framework for monitoring vital signs and water quality to protect and preserve ecosystems in U.S. national parks. Discover key features, purpose, and guidance for this essential program.

E N D
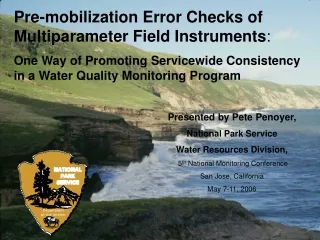
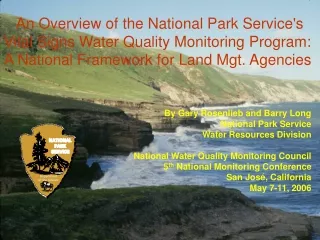
An Overview of the National Park Service's Vital Signs Water Quality Monitoring Program: A National Framework for Land Mgt. Agencies By Gary Rosenlieb and Barry Long National Park Service Water Resources Division National Water Quality Monitoring Council 5th National Monitoring Conference San José, California May 7-11, 2006
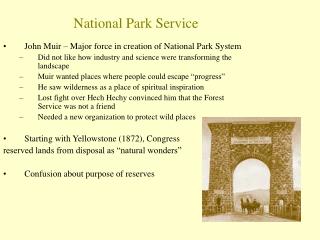
National Park Service Overview Established in 1916 by an Act signed by Woodrow Wilson Today the service manages under a “protect and preserve” mandate almost 380 areas encompassing 83 million acres in 49 statesadministered as National Parks, National Seashores, National Lakeshores, National Historic Sites, National Battlefields, and Presidential Libraries.
The Law: NATIONAL PARKS OMNIBUS MANAGEMENT ACT OF 1998 “The Secretary shall undertake a program of inventory and monitoring of National Park System resources to establish baseline information and to provide information on the long-term trends in the condition of National Park System resources. The monitoring program shall be developed in cooperation with other Federal monitoring and information collection efforts to ensure a cost-effective approach.”
2001 NPS Management Policies “Natural systems in the national park system, and the human influences upon them, will be monitored to detect change. The Service will use the results of monitoring and research to understand the detected change and to develop appropriate management actions”.
NPS Natural Resource ChallengeScience for Parks - Parks for Science • Add natural resource stewardship to NPS visitor services capability • Learn what is in parks (inventories), and monitor the vital signs of natural systems • Engage the scientific community and the public, and facilitate their inquiries • Share the information widely
Natural Resource ChallengeVital Signs Monitoring Revitalize and expand the natural resource program within the park service and improve park management through greater reliance on scientific knowledge
What are Vital Signs? Vital Signs are key elements that indicate the health of an ecosystem. Vital signs may occur at any level of organization including landscape, community, population, or genetic levels. They may be compositional (referring to the variety of elements in the system), structural (referring to the organization or pattern of the system), or functional (referring to ecological processes). Vital signs can be any measurable feature of the environment that provides insights into the state of the ecosystem. “Focus on most significant indicators of long-term ecological trends and highest concerns among the parks in each network”
Key Features of New Park/Network Monitoring Program (moving away from the stovepipe model) • Integrated monitoring program: physical and biological resources including weather, air, water, geoindicators, T&E species, exotic plants, other flora & fauna • Integrate NR information with other park operations including interpretation, maintenance, law enforcement • Emphasis on making information more useable; tools such as GIS Theme Manager, NR Database template, NPSpecies, Dataset Catalog, NatureBib Bibliography, interconnected web and distributed databases
What Is A Water Quality Monitoring Program? Best viewed as a Water Quality Information System that facilitates the flow of information between monitoring components resulting in management utilization of the information.
WATER QUALITY INFORMATION SYSTEMS (MODIFIED FROM WARD 1990, DESIGN OF WATER QUALITY MONITORING SYSTEMS) DETERMINE QUESTIONS AND OBJECTIVES FOR MONITORING SAMPLE COLLECTION DATA GENERATION LABORATORY ANALYSIS DATA MANAGEMENT AND ARCHIVING DATA ANALYSIS INFORMATION GENERATION REPORTING INFORMATION UTILIZATION ACCURATE UNDERSTANDING OF WATER QUALITY CONDITIONS
Purpose of Vital Signs Water Quality Monitoring • Track and Support Attainment of NPS and DOI Strategic (GPRA) Goals • Protect pristine water quality (e.g., ONRW) • Support additional CWA protections for unimpaired waters • Improve Impaired Water Quality (as defined in GPRA) • Support CWA provisions for improving water quality
Servicewide Vital Signs Long-Term Aquatic Monitoring Guidance Part A: Identification of priority impaired and pristine waters for the water quality vital signs monitoring component. Part B: Planning Process Steps. Issues to consider and then to document in a detailed study plan that includes a Quality Assurance Project Plan (QAPP) and monitoring "protocols" (Standard Operating Procedures) Part C: Draft guidance on WRD required and other field parameter measurements, general monitoring methods, and some design considerations in preparation of a detailed study plan. Part D: Draft guidance on laboratory analytes/ measurements and their consideration in preparation of a detailed study plan. Part E: Draft guidance on data reporting and archiving in STORET.
2 Broad Categories as Monitoring Program Drivers • Category 1 Sites – CWA or Regulatory Driven (State) • 303d-listed water body/stream segment (“water quality limited”) • TMDL is the “fix process” • Anti-degradation policy (Protection of Tiers 1, 2, & 3* waters) • *ONRW (special status) designation or desired objective (protection) • Meet an NPS strategic goal of “measurable or quantifiable” results (GPRA 1a.4) that a regulatory context provides through designated use criteria of narrative and numeric standards (see Part A of WRD Guidance) • Category 2 Sites – Network/Park ID’d Stressors or Threats • May not fail an existing designated use narrative or numerical standard but….. • Threats or stressors are identified • Present or future ecological impairments are possible or likely • Need to establish baseline condition (support anti-degradation) • Aquatic resource tie-in with other vital sign is apparent (e.g. Air Resource)
National Network/Ecosystem Park Servicewide Core Variables Network/Ecosystem Core Variables
NPS Natural Resource Challenge The NPS, for the first time, is developing a data management capability at the park, regional and national levels that will allow parks to make better use of existing data as well as making new data available to managers, researchers, the public and others.
KEY DATABASES 1. Water Quality Designated Beneficial Use Classifications 2. Servicewide Water Quality Data Management and Archiving
Water Quality Designated Beneficial Use Classifications • Prepare Designated Use and Impairment (DUI) Reports for parks • Provide the foundation for construction of a “certified database” for tracking the status of park water quality as required by Servicewide Strategic Plan Goal 1a4. • Enable NPS coordination with State and Federal agencies that are working to bring the nation’s waters into compliance with standards through implementation of Total Maximum Daily Loads (TMDLs) Objectives:
Designated Uses and Impairments (DUI) • CWA State designated uses • CWA 303(d) quality impaired waters and causes • Special designations recognizing waters of exceptional quality as defined in State water quality standards • Hydrographic statistics based on the USGS National Hydrography Dataset (NHD)
NPS Designated Use and Impairment Web Site
Water Resources of theNational Park System • 137,400 miles of rivers & streams • 1,550 miles of CWA 303(d) impaired rivers & streams
Water Resources of theNational Park System • 5,024,000 acres of lakes, reservoirs, estuaries and marine areas • 742,260 acres of CWA 303(d) impaired lakes, reservoirs, estuaries, and marine areas
Vital Signs WQ Data Flow Other DB (post 9/09) (Via WQX post 9/09) http://www.nature.nps.gov/water/infoanddata/index.htm
Virgin Islands National Park, VI NPSTORET • Microsoft Access-based • N.R. Database Template for Water Quality • Tailored to flow data to STORET • STORET-lite
Gary Rosenlieb National Park Service Water Resources Division 1201 Oakridge Drive Fort Collins, CO 80525 Phone: 970-225-3518 Email: gary_rosenlieb@nps.gov