SC Design Facility Location Strategy
160 likes | 179 Views
This article explores the use of frequency decomposition in facility location strategy, allowing for integrated decision-making in large supply chains. It discusses the impact of low, moderate, and high frequency activities on R&D, capacity expansion, and production decisions. Additionally, it examines the cost-response time frontier and the factors influencing facility location decisions.

SC Design Facility Location Strategy
E N D
Presentation Transcript
Frequency Decomposition • SCs are enormous • It is hard to make all decisions at once • Integration by smart decomposition • Frequency decomposition yields several sets of decisions such that each set is integrated within itself
Frequency Decomposition • Low frequency activity, ~ once a year, high fixed cost • R&D budget • Capacity expansion budget • Moderate frequency activity, ~ once a month • Cancellation of specific R&D projects depending on experimental outcomes • Specific machines to purchase • High frequency activity, ~ once a day, low fixed cost • What experiments to start / continue today • What to produce
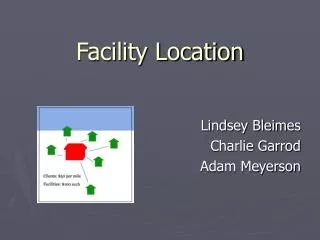
Facility Location: The Cost-Response Time FrontierAn inventory location based point of view 7-Eleven Regional Hi Local Finished Goods (FG) Inventory Regional FG Inventory Cost Local WIP (work-in-process) Central Sam’s Club Central FG Inventory Central WIP Central Raw Material and Custom production Low Custom production with raw material at suppliers Pull the inventory upstream Low Hi Response Time
Where inventory needs to be for a one week order response time - typical results --> 1 DC Customer DC
3 day order response time - typical results --> 5 DCs Customer DC
Same day / next day order response time - typical results --> 26 DCs Customer DC
Supplier Manufacturer Distributor Retailer Customer Inbound and outbound shipping with more facilities Supplier Manufacturer Customer Inbound shipment Outbound shipment Add more facilities for responsiveness Inbound shipment Outbound shipment More inboundshipping and less outbound shipping with more facilities. Less (inbound + outbound) shipping costs with more facilities possible, if economies of scale in transportation.
Total SC Inventory Facility costs Transportation Costs and Number of Facilities Costs Number of facilities No economies of scale in shipment size, SC covers a larger portion with each facility. With economies of scale in inbound shipping to retailers.
Cost Build-up as a function of facilities Total Costs Cost of Operations Facilities Inventory Transportation Labor Number of Facilities
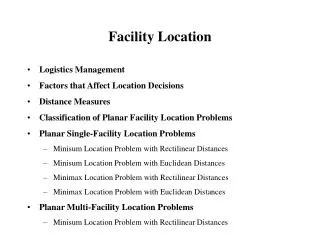
Classificationof Network Design Decisions • Facility function: Plant, DC, Warehouse: What facility performs what function • Packaging at the manufacturer or warehouse • Should a rental computer return location run diagnostic tests on the returned computers or should the testing be done at major warehouses? • Question arising from CRU Computer Rental Case done in OPRE6302 • Facility location • Starbucks opened up at UTD student apartments in 2005 but closed in 2006! • Recall Japanese 7-eleven and their blanketing strategy • SMU’s experimentation with Plano campus: http://www.smu.edu/legacy . • Capacity allocation • SOM car park took 80 cars in 2005 and expanded in 2006 to take about 110 cars, further expanded in 2009 to take about 300 cars. • Supplyand market allocation: Who serves whom • By location: UT Austin serves central Texas students • By grade: UT Arlington serves undergraduate students
Strategic Factors Influencing Location Decisions • Strategic Facilities Lead facility <advanced technology> Lockheed Martin’s JSF in Dallas Global Customers Regional Customers Outpost facility <Learn local skills> Facilities in Japan; Toyota Prius Server <local-content> Suziki’s Indian venture Maruti Udyog Offshore <reduced tariffs> <for exports> VW plants in Mexico Serving Latin America Contributor <customization> <development skills> Maruti Udyog Source <low-cost> Nike plants in Korea
FactorsInfluencing Location Decisions • Customer response time and local presence • Operating costs – main driver for offshoring • Technological, • Availability and economies of scale (fixed operational costs) • Semiconductor manufacturing takes place only in 5-6 countries worldwide • Infrastructure, electricity, phone lines, suppliers • Macroeconomic / Politic • Tariffs, exchange rate volatility, economic volatility • Economic communities: Nafta, EU, Pacific Rim, Efta • Stability • Logistics and facility costs • Competitive • Positive externalities • Nissan in India develops car suppliers which can also supply Suziki in India. • DFW Telecom corridor hosting Alcatel, Ericsson, Nortel, … • Toyota City, Shopping Malls • Negative externalities, see the next slide
Negative externality:Market Splitting by Hotelling’s Model 0 ab 1 1-a-b a b • Suppose customers (preferences, e.g. sugar content in coke) • are uniformly distributed over [0,1] • How much does firm at a get, how about firm at b • by locating as above? • - If a locates first, where should b locate? • - If a estimates how b will locate in response to a’s location, where should a locate?
Steps of Comparing LocationsAccording toMcKinsey Global Institute on HBR Jun. 2006 p.91 • 1. Draw up a list of possible locations • 2. Define the decision criteria • Six common criteria used by companies • 1. Cost of operating – tax incentives from local/federal governments • 2. Availability of the skills • 3. Sales potential in the adjacent markets • 4. Risk of doing the business • 5. Attractiveness of living environments • 6. Quality of infrastructure • 3. Collect data for each location • 4. Weight the criteria • Fortisbank of Belgium, wants to enter new large markets, gives highest weight to 3. • Citibank, wants a location for a captive IT center, gives the highest weight to 4. • Find risk data at • Economist intelligence unit: www.eiu.com • UN Development Program: http://hdr.undp.org/statistics/data/ • 5. Rank locations according to weighted sum of their scores • 6. Assess the dynamics of the labor pool • Availability of skilled labor: Top tier universities in large U.S. cities (e.g., Dallas?).
Summary • Frequency decomposition of activities • A strategic framework for facility location • Classification • Factors • Steps