Download
1 / 22
220 likes | 235 Views
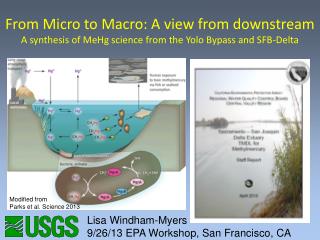
This text describes the use of NetMap tools to assess the impacts of climate change on fish habitat and watershed dynamics. It discusses the prediction of erosion, landslide, sedimentation, and stream temperature changes, as well as the identification of overlaps with sensitive fish habitats. It also highlights the integration of erosion models and climate predictions into NetMap for evaluating climate change implications and supporting decision-making in forest management planning.

E N D
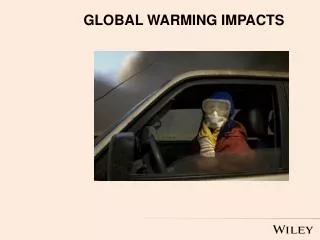
Impacts from a warming climate can cascade downstream Increase fire intensity Increase erosion and sedimentation Decrease summer flows and increase stream temperature
NetMap Tools Export to Google Earth
Differentiate among different types of fish habitat and their sensitivities to: -increased/decreased flow -thermal loading/temp -landsliding/debris flow -sedimentation
Predict shallow landslide potential, export to Google Earth, and identify overlaps w/habitats Red=higher risk Blue = lower risk More concern Less concern
Predict debris flow potential, export to Google Earth, and identify overlaps w/habitats Red=higher risk Blue = lower risk An area of higher concern
Use NetMap to quickly identify overlaps between high debris flow potential and high quality habitat Local areas of high risk for habitat impacts could lead to increased protection at those locations
ESI, working with William Elliot (USFS, Rocky Mountain Research Station) has integrated WEPP Surface (and road surface) erosion into NetMap (road, hillside, and post fire erosion) Areas of higher potential road surface erosion (overlaps with fish habitat?)
NetMap contains many watershed parameters and analysis tools that are potentially useful in evaluating the implications of climate change -aquatic habitat type, sensitivity -stream temperature -fire severity (Flammap etc.) -post fire erosion -stream sedimentation -stream flow -road erosion
Two approaches: • Climate predictions (GCM) are ‘downscaled’ • for air temperature (summer, winter), stream flow • (summer), and wildfire severity etc. and imported • into NetMap to quantitatively forecast impacts • related to climate change (this requires further • tool development); • or • A heuristic decision support approach - • existing parameters and tools are used to • map where in a watershed climate change • would have the greatest impacts • -increasing fire intensity and erosion • -increasing channel sedimentation • -increasing summer stream temperature • -decreasing summer flow
Begin by predicting fish habitat potential using a variety of NetMap tools Higher quality habitat Create custom fish habitat models
Next, examine how fire intensity (current or future climate) relates to erosion risk Flame length (Flammap) Surface erosion intensity (WEPP) Prelim
Next, examine how fire intensity (current or future climate) relates to erosion risk Flame length (Flammap) Surface erosion intensity (WEPP) Prelim From a climate change perspective, where would prescribed fire or thinning yield the most benefits
Predict effects of increased fire intensity on gully/landslide erosion potential
Then, search for overlaps between climate change related fire risk and erosion with fish habitat using automated tools in NetMap
Search for overlaps among increased fire risk, erosion potential & habitat quality Fire to Fish: Connect the Dots (channels)
Climate change impacts on fish habitat: Evaluate at subbasin scales NetMap contains tools for aggregating watershed data up to the scale of sub basins, informing larger scale, watershed planning efforts
Sensitivity of stream temperature to increases in thermal loading and air temperature Predict locations where climate change related increases in stream temperature would be most severe
Identify locations where climate change related decreases in summer low flow would have the greatest impacts (low gradient, unconfined stream segments) Reduced low flow impacts
Identify locations where climate change related decreases in summer low flow would have the greatest impacts (low gradient, unconfined stream segments) Reduced low flow impacts These subbasins with high sedimentation – low flow potential may benefit most from sediment reduction programs related to fire and roads
Design fire breaks according to climate change increases in fire severity and associated impacts on sensitive stream habitats
NetMap is a community supported watershed analysis system that can supply state of the art decision support in pre- and post fire forest management planning (and other land use efforts)