Download
1 / 1
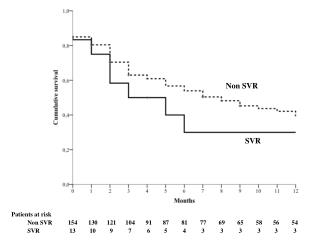
Impact of Neutrophil Levels on Patient Survival Over Time
10 likes | 104 Views
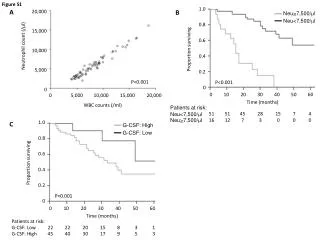
This study evaluates the correlation between neutrophil counts and patient survival rates, comparing high and low G-CSF treatments. Results indicate a significant association between neutrophil levels and survival outcomes.
Download Presentation 
Impact of Neutrophil Levels on Patient Survival Over Time
An Image/Link below is provided (as is) to download presentation
Download Policy: Content on the Website is provided to you AS IS for your information and personal use and may not be sold / licensed / shared on other websites without getting consent from its author.
Content is provided to you AS IS for your information and personal use only.
Download presentation by click this link.
While downloading, if for some reason you are not able to download a presentation, the publisher may have deleted the file from their server.
During download, if you can't get a presentation, the file might be deleted by the publisher.
E N D
Presentation Transcript
Figure S1 1.0 A 20,000 B Neu>7,500/ml Neu<7,500/ml 0.8 15,000 0.6 Neutrophil count (/ml) Proportion surviving 10,000 0.4 5,000 0.2 P<0.001 P<0.001 0 0 0 10 20 30 40 50 60 0 5,000 10,000 15,000 20,000 Time (months) WBC counts (/ml) Patients at risk: 51 51 45 28 15 7 4 Neu<7,500/ml Neu>7,500/ml 16 12 7 3 0 0 0 1.0 C G-CSF: High G-CSF: Low 0.8 0.6 Proportion surviving 0.4 0.2 P<0.001 0 0 10 20 30 40 50 60 Time (months) Patients at risk: G-CSF: Low 22 22 20 15 8 3 1 G-CSF: High 45 40 30 17 9 5 3


More Related