Download
1 / 54
540 likes | 757 Views
The New Economics of Crop Production in Wisconsin: Crop Consultants’ Perspective. Paul D. Mitchell Assistant Professor Agricultural and Applied Economics University of Wisconsin-Madison 2008 WAPAC Spring Seminar Arlington, WI March 6, 2008. Goal Today. Part I:

E N D
The New Economics of Crop Production in Wisconsin:Crop Consultants’ Perspective Paul D. Mitchell Assistant Professor Agricultural and Applied Economics University of Wisconsin-Madison 2008 WAPAC Spring Seminar Arlington, WI March 6, 2008
Goal Today Part I: • Economics of Corn vs. Soybeans vs. Wheat Part II: • Overview Crop Insurance • Crop Insurance Hints for 2008 • Crop Insurance changes coming
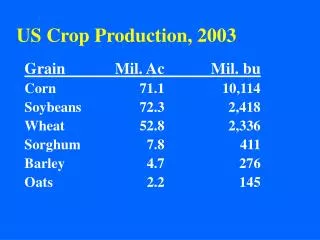
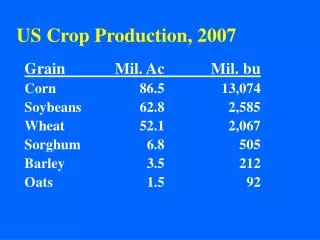
Crop Prices are High • Closing prices on CBOT Wednesday 3/5 • Dec 08 corn $5.77/bu • Nov 08 soybean $13.91/bu • Sep 08 wheat $10.59/bu • Sep 08 oats $4.45/bu • These prices drive the image that farmers are rolling in the money
Yields are Increasing Annual increase (bu/ac) in NASS county average yield from 1977 to 2006 as estimated by regression
Input Costs Have Also Increased • Fertilizer prices are leading the way • Seed is also up about 15%
U of IL non-land costs for corn and soybean production in northern IL Corn up $42/ac from 2007 Soybeans up $18/ac
Annual Increase: U of IL non-land costs for corn and soybeans in northern IL Costs are Rising faster and faster
$$ $$ $$ The “Real” Economics of Corn and Soybeans
Quick Cost of Production Estimates • Quick cost of production and net returns estimates for corn, soybeans and wheat in Wisconsin • Use major cost categories • Neither scientific nor rigorous, but based on simple assumptions • Farmers should do their own cost and returns projections
Seed Costs • Corn • 34,000/ac @$190/bag = $80.75 • Soybeans • 1.2 bag/ac @ $32/bag = $38.40 • Wheat • Assume $35/ac • Lots of numbers out there • Depends on variety, germination rate, etc.
Machinery Costs • Hard to estimate/measure • Very specific to each farmer • Use estimates for 2008 machinery costs from Iowa State University • Adjusted upwards for WI about 25% for pre-harvest tillage, about 5% for harvest • Smaller fields and farms • Higher custom rates
Cost Estimate Summary Does not include cost for land, management, or investment of capital
How do you decide what to plant? • Can use university budgets or other peoples’ estimates of the yields, prices, costs, and net returns to different crops • Problem: These are usually averages or even guesses • Reality: Costs and returns vary greatly among farmers • You want your costs and returns
Corn 1996 Data for about 250 Minnesota Corn and Soybean Farmers Source: K. D. Olson and H. D. Lohano “Will the true cost of production please stand up?” Soybeans
Illinois Data for 2006 Source: Gary Schnitkey “Crop Production Cost and Rotation Decisions”
Making Budgets • Make budgets to estimate your net returns for corn after soybeans, plus corn after corn, soybeans, and wheat • Budgets can be as simple or detailed as you want to make them: you decide • Estimate your costs and returns, as it is your money, your responsibility, you live with the consequences of your decisions
Wisconsin Resources Available • My Extension web page www.aae.wisc.edu/mitchell/extension.htm • UW-Team Grains web page www.uwex.edu/ces/ag/teams/grains/ • UW Center for Dairy Profitability www.cdp.wisc.edu/crop%20enterprise.htm • Detailed Excel spreadsheets with base cases and then you enter your numbers
How to help clients be as profitable as possible? Recommend judicious input use • Fertilizer is and will be expensive • Use soil tests, nutrient crediting and recommended rates to control costs • Properly calibrate application equipment or know which applicators do so • Forward price fertilizer, especially P • Think about on-farm (or in-field?) storage possibilities
Current and future fertilizer prices 1Landmark Services Coop 2Frontier FS Coop
Planting Density for Corn • See Joe Lauer’s recent publications on “Guidelines for Managing Corn Seed Costs” • Optimal planting densities have increased for newer hybrids and for Bt corn • http://corn.agronomy.wisc.edu/AA/2006/A044.htm • Recommended density depends on the corn:seed price ratio and it’s higher than most farmers are used to planting • Maybe try some on farm experiments this year?
Optimal Harvest Plant Densities Guidelines for Managing Corn Seed Costs, J. Lauer and T. Stanger. Agronomy Advice, Dec. 2006
Judicious Pesticide Use • Scout for pests (soybean aphids) and diseases to catch them before losses occur • Scout weeds, use right herbicides for the weeds they have and control when they are small • Stay in touch with multiple suppliers on chemical prices and availability • Know which chemicals are expensive or in short supply • What are the alternatives to help reduce input costs? • Who has which chemicals at what cost?
Pesticide Prices and Availability • Companies ready to sell as much as they can, to take advantage of higher demand • Supplies and prices could be an issue if we get unexpectedly large demand • Fungicides if soybean rust hits hard • Insecticides if have soybean aphid explosion • Specific chemicals have higher prices (roundup, atrazine) or tighter supply due to plant closings • Applicator/equipment availability maybe more of an issue
2008 Crop Insurance Overview • Overview current crop insurance programs for corn, soybeans and wheat • Crop Insurance Hints for 2008 • Crop Insurance changes coming
Types of Policies • APH: Actual Production History • Individual Yield Insurance • CRC: Crop Revenue Coverage • Individual Revenue Insurance • GRP: Group Risk Plan • Area-wide (County) Yield Insurance • GRIP: Group Risk Income Protection • Area-wide (County) Revenue Insurance
APH: Actual Production History • If your harvested yield is less than your yield guarantee, receive an indemnity • Yield guarantee: average of your actual harvested yields for last 4-10 years • Coverage Level: Determines yield trigger • Choose percentage of your average yield as your guarantee, from 50% to 85% by 5% intervals • Price Election: Determine price for losses • Choose price paid for each bushel below your guarantee, from 100% to 55% of established price
If you observe farmer has a loss • If you think you farmer has a loss, farmer shouldcontact his crop insurance agent • Documentation of losses and practices is key • Likely leave crop standing for loss adjustment • Stalk rot/lodged corn, Aflatoxin a loss • Wildlife damage a loss: deer, wild hogs, geese • Alternative uses: Be careful before you graze • Poor management is not insurable cause of loss • Lots of rules, don’t forfeit indemnities by making a mistake
CRC Crop Revenue Coverage • Combines APH with price protection based on CBOT futures prices • Farmers APH yield history and CBOT prices sets preliminary revenue guarantee • Same coverage level options, same unit structures • Revenue at harvest is yield x CBOT prices (Nov average of Dec corn) • If harvest revenue is below guarantee, triggers an indemnity payment
CRC protects againstprice increases and decreases • If price falls or have low yield, know will have grain or money to buy grain to fulfill contracts • If price increases by harvest, revenue guarantee increases too, so again know will have grain or money to buy grain to fulfill contracts • Can market more aggressively since will have grain or indemnities to buy grain at the existing market prices if have a yield loss • Careful: are limits to price swings CRC covers
CRC Price Limits • CRC limits the harvest price swings it covers to no more than $1.50 for corn and $3.00 for soybeans • Much more likely in 2008 with current high prices and associated volatilities • Gary Schnitkey, U of IL FarmDOC “Impacts of CRC Price Limits on the Value of CRC Relative to RA” http://www.farmdoc.uiuc.edu/manage/newsletters/fefo08_04/fefo08_04.html
Corn $5.30/bu base Soybeans $13/bu base • If harvest prices move outside the $1.50 or $3.00 range, farmer revenue guarantees will not update enough to buy grain at the prevalent harvest price • Implication: be more careful with overly aggressive marketing based on CRC revenue guarantees 31% chance 39% chance
GRP Group Risk PlanGRIP Group Risk Income Protection • GRP = APH, except uses NASS county average yield • GRIP with Harvest Revenue Option is RA, but with NASS county average yield • Does not have price swing limits (like RA) • GRP/GRIP Not available for Wheat in WI • GRP/GRIP payments not made until Mar/Apr when NASS yields come out
Lots of Crop Insurance Rules • Rules on: Planting dates, Late/prevented planting, Double cropping, Alternative crop uses, Corn maturity, Yield guarantees, Breaking new ground (CRP vs pasture) • Be sure you are not recommending practices that violate crop insurance rules • Insurance agents do not always know all rules • Call RMA St. Paul regional office 651-290-3304
Hints for Using Crop Insurance in 2008 • CRC will be popular again this year • Yield Risk: same as it has always been • Price Risk: increased with higher volatility • Investment Risk: high input costs mean larger investment in planted fields: want more protection against crop failure/loss • Premiums high in 2008 with high crop prices • Dairy/Livestock can use CRC indemnities to buy grain at current prices if have a loss
GRIP/GRP • GRIP popular with large, low risk producers • You may have yield histories to help producer see if APH/CRC will be likely to pay for them • If unlikely, GRIP may be a good idea for them, to get price protection, some yield protection • Download NASS county yield to look at how likely GRP/GRIP to pay • See “Is GRP a Good Deal for my corn in 2008?” • Potentially useful for irrigated farmers • Offset irrigation costs in dry years
GRP/GRIP for Corn in Wisconsin • Important issue for Corn: Which county yield do you choose to insure, yield per planted acre or yield per harvested acre? • Only in Wisconsin is there a choice • Because of dairy, in years with marginal corn yields, poorer corn chopped for silage • Yield per harvested acre can remain high, even though it’s a bad year • Which is better? Depends on the county!
Is GRP a good deal for my Corn and Soybeans? • Bulletins posted on my webpage (soybeans soon) • Analyze county yield data and estimate the expected return to GRP in bu/ac for each Wisconsin county that has GRP • Expected return = long run average net return to GRP if everything constant over many years • If GRP is valuable for a county, GRIP will be valuable too, as it adds price protection • If GRP is not valuable for a county, GRIP can still make sense, to get the price protection
Planted Acres Harvested Acres > 1 0 to 1 -1 to 0 -2 to -1 < -2 No Data > 1 0 to 1 -1 to 0 -2 to -1 < -2 No Data Side-by side comparison (regression yields)
Planted Acres Harvested Acres Side-by side comparison (RMA yields)
Regression vs. RMA: What’s the difference? This little gap drives the difference Calumet County
> 1 ½ to 1 0 to ½ -½ to -1 < -1 No Data > 1 ½ to 1 0 to ½ -½ to -1 < -1 No Data Soybeans: Regression vs. RMA Regression RMA