Download
1 / 7
70 likes | 191 Views
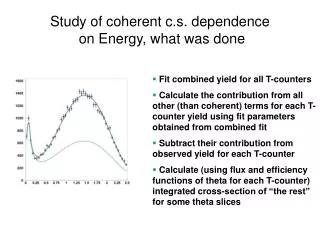
Study of coherent c.s. dependence on Energy, what was done. Fit combined yield for all T-counters Calculate the contribution from all other (than coherent) terms for each T-counter yield using fit parameters obtained from combined fit

E N D
Study of coherent c.s. dependence on Energy, what was done • Fit combined yield for all T-counters • Calculate the contribution from all other (than coherent) terms for each T-counter yield using fit parameters obtained from combined fit • Subtract their contribution from observed yield for each T-counter • Calculate (using flux and efficiency functions of theta for each T-counter) integrated cross-section of “the rest” for some theta slices
Study of coherent c.s. dependence on Energy (T-counter), results for theta slices q = 0.5 – 2.0 q = 0.0 – 0.5 Dashed lines show subtracted (expected) contribution from incoherent term. q = 0.5 – 1.5 q = 1.5 – 2.5
Rad. Width sensitivity to single gamma energy cut value Method 1: vary cut value and see how result (with no additional correction for efficiency) depends on it. 10% variation from cut value (0.5GeV) was used as a probe. This cut variation is changing result by 0.2% Cut variation Used cut
Rad. Width sensitivity to single gamma energy cut value Method 2: vary cut value and see how result (with corrected efficiency) depends on it. Final result shows 0.2% fluctuations from the mean value (may be statistical only)
Rad. Width sensitivity to single gamma energy cut value Conclusion: error budget contribution from this item is 0.2%
Corrections applied to final result: Clock frequency -2.4%; not confirmed yet Tagger Energy corrections expected yield (cross-section dependence on E) Hycal gains and Hycal Z ~+1 cm (by placing elastic peak and p0 mass in right place) Efficiency for new energies Selecting “best in time beam candidate”: Defined as N(p0 “not best in time”) / N(p0 “best in time”) Check syst. By artificial time shift by Dt = 1.5ns Syst. = | Deff.| / | Dt | * st; Used st = 0.5ns, but should be less in practice 100nA runs 0.7% ± 0.1%stat ± 0.2%syst. Added part of statistics: 130nA runs 1.0% ±0.1%stat ±0.3%syst. 110nA runs 1.0% ±0.2%stat ±0.2%syst. Tagging ratio systematic decreasing during run time (Aram study): 100nA runs k = 1.000 (no correction) 130nA runs k = 1.005 110nA runs k = 1.010
Reanalyzing lifetime with all corrections applied(except clock frequency): 100nA runs: 8.1eV 130nA and 110nA runs: 8.3eV All above data sets together: rad. width = 8.2 ± 0.19 eV; interf. angle = 0.86 ± 0.06 rad.; Cs = 1.7 ± 0.06 ubarn; Ci = 4.6 ± 0.5 ubarn reduced chi2 of the fit = 1.25 for 0 – 0.5 deg. region = 1.09


![DATAFLOW TESTING DONE BY A.PRIYA, 08CSEE17, II- M.s.c [C.S].](https://cdn1.slideserve.com/3498564/slide1-dt.jpg)