Download
1 / 172
1.72k likes | 1.93k Views
Microarrays, Expression, and Regulatory Networks. Thanks to Prof. Mehmet Koyuturk, Case Western Reserve University. Central Dogma. A functional protein (or sometimes, RNA) that is coded by a particular gene is often called the product of that gene. Gene Expression.

E N D
Microarrays, Expression, and Regulatory Networks Thanks to Prof. Mehmet Koyuturk, Case Western Reserve University.
Central Dogma A functional protein (or sometimes, RNA) that is coded by a particular gene is often called the product of that gene
Gene Expression • Gene expression is the process of synthesizing a functional gene product (protein or RNA) from a segment of DNA that specifies inheritable information ( a gene) • In a multicellular organism, all cells contain identical genomes, but different genes are expressed in different types of cells • Regulation of gene expression • Development, response to environmental signals
Studying Genome-wide Expression • The types and of expression levels of prescribed genes are linked to the phenotype of a cell • The concentration of mRNA corresponding to each gene in the genome provides a measure of gene expression • Gene expression is regulated at various stages, so mRNA concentration is not necessarily a perfect indicator of the activity of a gene (in terms of the activity of gene product) • Splice variants • Post-translational modification • Proteomics
Research Questions • Knowledge of genome-wide expression makes it possible to study fundamental questions related to gene expression • What genes are expressed in what cell types (e.g., different tissues)? • How does gene expression change over time (e.g., cell cycle)? • How does a certain type of disease influence the expression of one or more genes to alter phenotype? • How do the expression levels of different groups of genes change under different conditions? • How do genes regulate each other’s expression?
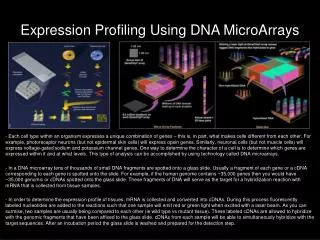
DNA Microarray Technology • Measure the amount of mRNA (corresponding to each gene) existing in a given cell in bulks (for thousands of genes) • The major tool in transcriptomics • It is possible to measure the expression of a large number of genes (often, the entire genome) in a single sample • Makes it possible to compare the expression levels of several genes in one sample • Large-scale application of traditional techniques • Hybridization-based methods
Hybridization • The process of joining two complementary strands of DNA or one each of DNA and RNA to form a double-stranded molecule • Key idea in microarray technology
What is a DNA Microarray? • A DNA microarray is a slide onto which a regular pattern of spots is deposited • Each spot contains many copies of a specified single-stranded DNA sequence (i.e., multiple biologically identical sequences) • All sequences are chemically bonded to the surface of the slide • There is a different DNA sequence at each spot (i.e., the sequences at different spots are biologically different) • Spots are small • Can fit thousands of spots on a single slide a few centimeters across
How do DNA Microarrays work? • The DNA sequences in spots act as probes that hybridize with complementary sequences • If complementary sequence exists in the sample, the corresponding DNA sequence in a spot will hybridize • Solutions extracted from tissue samples contain large numbers of mRNAs of many different types that happen to be present in the cells at the time of the experiment • The amount of mRNA hybridized in a spot provides an estimate of the concentration of the mRNA in the sample • Each spot targets a different type of mRNA (gene)
Measuring mRNA Concentration • The spots in which hybridization takes place can be visualized using fluorescence techniques • Sequences in the sample are fluorescently labeled • The DNA that hybridizes is visually identifiable as glowing spots on the array • Spots that have nothing hybridized are not visible • The intensity of fluorescence at each spot is proportional to the amount of the corresponding type of mRNA in the sample • DNA microarrays can detect presence of sequences corresponding to all spots simultaneously
Types of Microarrays 1. Oligonucleotide arrays 2. cDNA arrays
Oligonucleotide Arrays • Oligo: Just a few, scanty • Oligonucleotide arrays use short DNA sequences (in the spots) • Usually 25 nucleotides • Several spots correspond to one gene • Oligonucleotides are synthesized in situ based on the sequences • One base at a time • Sometimes called a chip • Commercially manifactured by Affymatrix
Production of Oligonucleotide Arrays Photolitography & combinatorial chemistry
Hybridization Specificity • Each oligonucleotide should hybridize to a specific gene in the organism • Short sequences => Cross hybridization is more probable • There are a lot of genes in an organism with related sequences • Perfect match/Mismatch (PM/MM) probe strategy • Two spots for each oligonucleutide • PM: Identical to the target • MM: Differs only at the base in the middle of sequence • Assumption: non-specific binding is identical for PM and MM probes • PM-MM provides a measure of specific hybridization
cDNA Arrays • A cDNA is a DNA strand synthesized using a reverse transcriptase enzyme, which makes a DNA sequence that is complementary to an RNA template • Reverse of what happens in transcription • It is possible to synthesize cDNAs from mRNAs present in cells • There are cDNA libraries that contain sequences of genes known to be expressed in particular cell types • Use cDNA sequences as probe sequences on microarrays • Knowledge of sequence is not necessary • Experimentally identifying a set of suitable cDNAs is sufficient
cDNA Arrays • cDNAs are quite long: 500-2000 bases • Hybridization is much more specific • A cDNA contains a large fraction of a gene sequence, but not necessarily the entire gene • Generally, one spot is adequate to recognize a single gene • The process of array manufacture is less reproducible • It is not easy to control the amount of DNA at each spot • It is not usually possible to compare absolute intensities of spots from different slides • Use two samples on one array!
Two-color Hybridization • Two samples • One test sample • One control (reference) sample • Prepare RNA extracts from each sample separately • Make cDNA from each sample using nucleotides labeled with a different color • Reference sample: Green (Cy5) • Test sample: Red (Cy3) • Mix labeled populations, let mixture to hybridize with array • cDNAs from different samples should bind to spot in proportion to their concentrations
Two-Color Hybridization • Red spot: The gene is expressed significantly more in the test sample • Green spot: The gene is expressed significantly more in the reference sample • Yellow spot: The gene has about the same expression level in both samples • The fraction of red intensity to green intensity provides a measure of relative expression
Use of Two-Color Hybridization • Compare cell/tissue samples • Cells before and after an experimental perturbation • Successive times during a temporally staged process • Between stages of differentiation • Mutant cell vs. wild type • How do we compare multiple samples? • Time-course experiments
Comparing Multiple Samples • Choose a single reference sample • Need not be related to samples being examined • Time course experiments: Initial sample • Since the concentration of each mRNA in the reference sample is mixed, the relative expression with respect to reference sample provides a fair comparison between all other samples • Reference sample should provide a hybridization signal for each gene (should have non-zero mRNA concentration) • Approximation to ideal reference sample: Equal mixture of material from all samples
Oligonucleotide vs. cDNA Arrays • cDNA does not require probe design • cDNA provides higher specificity due to longer sequences of targets • However, cDNA may contain repetitive sequences that are often obtained in various genes • Techniques like PM/MM enhance specificty of oligonucleotides • cDNA arrays are more useful on a global level • Screening steady-state mRNA expression levels • Oligonucleotide arrays are more useful when more precise analysis is required • SNPs
Relative Expression • Ri : Red intensity (test sample) • Gi : Green intensity (reference sample) • Intensity ratio: Ti = Ri / Gi • If > 1, the gene is up-regulated in the test sample • If < 1, the gene is down-regulated in the test sample • Eliminates spot-to-spot variability to a certain extent
Channel Normalization • There are millions of individual mRNA molecules in one sample • It can be assumed that the average mass of each molecule is approximately the same • It can be assumed that arrayed elements represent a random sampling of the genes in the organism • We use two samples of equal mass, so the total hybridization intensities should be the same
log Ratio • Mi =log2(Ri / Gi) • log-transformation makes the distribution closer to normal distribution • Mi = 1 => gene i’s expression level is doubled • Mi = -1 => gene i’s expression level is halved • Mi = 0 => gene i’s expression level is unchanged
Average Intensity of a Spot • log-scaled geometric average of the intensities for the test and reference samples • A measure of the overall expression of a gene
Ratio/Intensity Plot x axis: overall expression of a gene y axis: change in expression of a gene (across samples)
Mean Relative Intensity • For a gene whose expression level has not changed, we expect that Ri / Gi so that Mi = 0 • Most genes should have unchanged expression level • In our example, most points are below the horizonal axis • This is likely to be because of a systematic bias, rather than suggesting that most genes are down-regulated in the experiment • Dye bias • Efficiency of labeling in two DNA populations may be different • Binding between DNA and probe may be affected by the dye in a systematic way • Efficiency of detecting flourescent signal may be different
Array Normalization • Used to minimize systematic variations in the gene expression levels of the two samples hybridized to the array and allows comparison of gene expression levels across multiple slides • Main assumption: After log-transformation the distribution of relative intensity values approach a normal distribution
Housekeeping Genes • Normalize using housekeeping genes • A housekeeping gene is one that is assumed to be expressed at a constant level that does not change between reference and test samples • Shift data so that we will have Mi = 0 for housekeeping genes • It is not easy to find genes whose expression will surely remain unchanged
Global Normalization • Subtract the mean relative intensity over all spots from all spots so that the mean will be zero • All these methods are global in the sense that they only change the position of the cloud of points in the M/A plot, not the shape
Self-Normalization • Dye-flip experiments • Another way of eliminating dye bias • Perform a second experiment by in which the red and green labeling of samples is done in reverse • Subtract Mi values from each other • Result will be twice the unbiased Mi value, since the term that corresponds to bias will be canceled out • The normalized value of each spot depends only on the measured intensity ratios for that spot • Bias is assumed to be independent in all spots • Bias is assumed to be reproducible between arrays
Intensity-Dependent Bias • Bias may depend on the average intensity on a spot • In our example, there is an upward trend in the Mi values for higher values of Ai • Whether a gene (on a global sense) is up- or down- regulated should not depend on its average expression level • Fluorescence detector may be saturated at high intensity
LOWESS • LOcally WEighted Scatterplot Smoothing • Fit a smooth curved function m(A) through the data points • This is an estimate of bias as a function of average intensity • Correct values as • The shift depends on the average intensity on the spot, but the function that determines shift is global • Neither global nor self-normalization
Gene Normalization • Array normalization makes arrays cross-comparable • Two identically expressed genes in terms of Cy5 intensities may end up having different log ratios • Solution: Center expression values for each gene so that each gene will have mean (or median) expression value of 0 • Example (on blackboard)
Gene Expression Matrix Samples Genes Now, we are ready to analyze our data!
Analyzing Gene Expression Data 4. Gene Expression Data Analysis • Clustering • How are genes related in terms of their expression under different conditions? • Differential gene expression • Which genes are affected by change in condition, tissue, disease? • Classification (supervised analysis) • Given expression profile for a gene, can we assign a function? • Given the expression levels of several genes in a sample, can we characterize the type of sample (e.g., cancerous or normal)? • Regulatory network inference • How do genes regulate each others expression to orchestrate cellular function? 40
Clustering 4. Gene Expression Data Analysis • Group similar items together • Clustering genes based on their expression profiles • We can measure the expression of multiple genes in multiple samples • Genes that are functionally related should have similar expression profiles • Gene expression profile • A vector (or a point) in multi-dimensional space, where each dimension corresponds to a sample • Clustering of multi-dimensional real-valued data is a well-studied problem 41
Motivating Example 4. Gene Expression Data Analysis Expression levels of 2,000 genes in 22 normal and 40 tumor colon tissues (Alon et al. , PNAS, 1999) 42
Applications of Clustering 4. Gene Expression Data Analysis • Functional annotation • If a gene with unknown function is clustered together with genes that perform a particular function, then that is likely to be associated with that function • Identification of regulatory motifs • If a group of genes are co-regulated, then it is likely that their regulation is modulated by similar transcription factors, so looking for common elements in the neighborhood of the coding sequences of genes in a cluster, we can identify regulatory motifs and their location (promoters) • Modular analysis 43
Gene Expression Matrix 4. Gene Expression Data Analysis n samples • Generally, m >> n • m = O(103) • n = O(101) • Each row is an n-dimensional vector • Expression profile m genes 44
Proximity Measures 4. Gene Expression Data Analysis • How do we decide which genes are similar to each other? • Euclidian distance • Manhattan distance 45
Distance 4. Gene Expression Data Analysis • Minkowski distance • General version of Euclidian, Manhattan etc. • p is a parameter 46
Normalization 4. Gene Expression Data Analysis • If we want to measure the distance between directions rather than absolute magnitude, it may be necessary to standardize mean and variation of expression levels for each gene 47
Correlation 4. Gene Expression Data Analysis • The similarity between the variation of two random variables • A vector is treated as sampling of a random variable • Covariance 48
Pearson Correlation Coefficient 4. Gene Expression Data Analysis • Pearson correlation coefficient • Pearson correlation is equal to the cosine of the angle (or inner product of) normalized expression profiles • Pearson correlation is normalized 49
Euclidian Distance & Correlation 4. Gene Expression Data Analysis • Euclidian distance (normalized) and Pearson correlation coefficient are closely related • These are the two most commonly used proximity measures in gene expression data analysis • Without loss of generality, we will use to denote the distance between two expression profiles 50