Download
1 / 1
10 likes | 218 Views
A Qualitative and Quantitative Analysis of Bone Porosities through the Tabletop Scanning Electron Microscope. Results. Materials and Methods

E N D
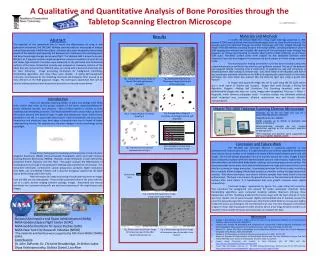
A Qualitative and Quantitative Analysis of Bone Porosities through the Tabletop Scanning Electron Microscope Results Materials and Methods 3 months old female BALB mice tibiae (right hind leg) preserved in 70% ethanol (ETOH) were obtained from the Biotechnology Center at Stony Brook University. The samples were first observed through an optical microscope and then imaged through the Hitachi TM-1000 tabletop scanning electron microscope (SEM). Sample preparation prior to SEM imaging was minimal and included the removal of the periosteum layer through fine tweezers, air drying and mounting on double sided carbon coated adhesives on aluminum SEM stubs. Periosteal surface pores were imaged on the latitudinal direction while intracortical porosity was imaged on transversely cut bone sample, all under charge-reduction mode. Two techniques for making a transverse cut of the bone included cutting with a diamond wheel saw and fracturing with the razor guillotine method. The use of the diamond saw required sample mounting onto a small piece of graphite by wax and immersion in ethanol/acetone after cutting to remove wax. Cuts were made at the diaphysis and half of the sample was mounted vertically on the SEM stub exposing the sawed section. In the latter technique, the razor blade was pressed into the bone by light taps using a pestle until fracture. In ImageJ each grayscale image was set to scale using the Set Scale option and a small region of interest was cropped. Images then went through a Rolling Ball Algorithm, Pluggins ->Rolling Ball Correction. The Shanbhag threshold, under the Multithreshold pluggin was then run. Lastly, images were despeckled, Processes -> Noise -> Despeckle, which removes salt/pepper noise. A particle analysis was ultimately achieved, which outputted area, perimeter, elliptical major/minor axis and Ferrets diameter measurements6. Abstract The objective of this experiment was to access the effectiveness of using a new generation instrument, the TM-1000 tabletop scanning electron microscope to analyze cortical bone porosity in BALB mice tibiae. Scientists have been intrigued by the porosity growth of the skeleton and especially the development of diseases such as Osteoporosis and bone morphology changes during spaceflight. The tabletop SEM is proven to be very efficient, as it requires minimal sample preparation, acquires resolutions of up to 30 nm and shows high contrasts. Porosities were measured on the periosteal and intracortical surfaces of the bone. Intracortical porosity was analyzed on transverse sections of the tibiae that were prepared two different ways, by cutting with a diamond wheel saw and by razor fracturing. Image processing techniques for background smoothing, thresholding algorithms, and noise filters were studied. A rolling ball background correction accompanied by the Shanbhag threshold and Despeckle filter proved to be most efficient on the SEM grayscale images. The techniques established here will be used to analyze periosteal and intracortical porosities on disused mouse bones. Fig. 1 Optical Microscopy Image of Mouse Tibia with periosteum removed Fig. 2 Backscattering electron Microscopy Image of periosteal surface porosities Introduction Pores are naturally occurring entities in bone and emerge from three main cavities that make up the porous network of the bone: Haversian/Volkmann’s canals, osteocytic lacunae, and canaliculi. Each of these cavities is intrinsic to bone modeling and remodeling processes. The Haversian/Volkmann’s canals make up most of the cortical porosity and become larger in aged and osteoporotic bone. Cortical bone perforations can tell us a great deal about bone’s material properties and processes5. Researchers and physicians have been eager to quantify pore sizes in hopes of better understanding diseases like osteoporosis and even changes in bone morphology during spaceflight. Conventional techniques for analyzing cortical porosity include, Nuclear Magnetic Resonance (NMR), Micro-computed Tomography (CT) and Field Emission Scanning Electron Microscopy (FESEM). However, certain limitations in each method has prevented further discovery into this field. This paper analyzes the effectiveness of studying porosity through a new generation tabletop scanning electron microscope. This instrument eliminates cumbersome sample preparation, produces higher resolutions than NMR, CT and FESEM (~30nm) and is ideal for biological samples like the BALB mouse bones being used in this study. New techniques for image processing of backscattering electron images from the SEM are also investigated. They provide quantitative data of the pores with the use of a public domain imaging software package, ImageJ. Automated and manual techniques are compared along with pre and post processing of the original grey scale images. Hitachi TM-1000 Tabletop Scanning Electron Microscope • resolves up to 30 nm with the use of a backscattering electron detector • Magnifications:20–10000x • holds samples up to 70mm in diameter and 20mm in thickness • Non-conductive samples do not require conductive coatings as the instrument operates on low vacuum7. *The materials and facilities were supported by NSF Grant MRSEC DMR05-20495 Fig. 4 Image after rolling ball correction, Shanbhag threshold and despeckle Fig. 3 Cropped Region of Interest from Fig.2 Conclusion and Future Work The TM-1000 was extremely efficient in capturing porosities on the periosteal and intracortical surfaces. It’s high-resolution and contrast capabilities allowed the most minute mouse cavities to be imaged and clearly differentiated between pores and soft tissues. The limited sample preparation was also one less avenue for errors. Images 8 and 9 show intracortical surfaces after the diamond wheel saw and razor fracture, respectively. The diamond wheel saw left behind blade marks, cracking, and covered pores on the surface. The fractured sample shows pores more distinctively however the rough and uneven surface is not ideal for scanning or image processing. A promising technique for future studies is polishing the cut sample before imaging, which might produce a smoother surface to judge intracortical porosity. With these techniques, new control and test samples from Stony Brook University will be tested. The hope is to compare the growth of pores on the periosteal and intracortical surfaces after bone disuse. It is hypothesized that pore growth increases more rapidly intracorticaly. Processed images, represented by figures 3-6, used rolling ball correction that smoothed the background and allowed for better automated threshold. Many thresholding algorithms were compared including IsoData, Maximum Entropy, Otsu, Renientropy and Yen. Shanbhag produced the binary image with the least amount of noise and most realistic size of pores however slightly overestimated due to shadows around the pores.The despeckle algorithm removed noise that the threshold failed to remove and slightly eroded the pores, accounting for the overestimation of area. The pore histogram represented in figure 6 shows that the greatest number of pores falls in a size range between 0 and 0.1 m however further studies of mouse bone porosities can validate this data. Fig. 6 Histogram of Pore Area distribution among 3 images Fig. 5 Numbered and outlined representation of Fig 4 Intracortical Layer Fig. 7 Backscattering electron image of transverse view of tibia Sponsors: National Aeronautics and Space Administration (NASA) NASA Goddard Space Flight Center (GSFC) NASA Goddard Institute for Space Studies (GISS) NASA New York City Research Initiative (NYCRI) *The materials and facilities were supported by NSF Grant MRSEC DMR05-20495. Contributors: Dr. John DaPonte, Dr. Christine Broadbridge, Dr.Stefan Judex Divya Krishnamoorthy, Dalisha Daniel, Lisa Alter References Graham J, Ries Michael, Pruitt L. Effect of Bone Porosity on the Mechanical Integrity of the Bone-Cement Interface. J Bone Joint Surg Am. 2003;85:10. Cooper D.M.L, Maytas J.R, Katzenberg M.A, Hallgrimsson B. Comparison of Microcomputed Tomographic and Microradiographic Measurements of Cortical Bone Porosity. Calcif Tissue Int. 2004; 74: 437-447. Wronski T.J , Morey E.R. Effect of Spaceflight on Periosteal Bone Formation in Rats. Am J Physiol Regulatory Integrative Comp Physiol. 1983; 244: 305-309. Seeman E. The Periosteum-a surface for all seasons. Osteoporos Int. 2007; 18:123-128. Xiaodu W, Qingwen Ni. Determination of Cortical Bone Porosity and Pore Size Distribution Using a Low Field Pulsed NMR Approach. Journal of Orthopaedic Research. 2003; 21:312-319. ImageJ, Image Processing and analysis in Java. Retrieved July 20 2009 web site: http://rsb.info.nih.gov/ij/docs/menus/analyze.html Hitachi High Technologies America, Inc. TM-1000 Tabletop Microscope. Retrieved July 15 20 2009 web site: http://www.hitachi-hta.com/pageloader~type~product~id~450~orgid~42.html Fig. 8 Backscattering electron image of transverse view of tibia after diamond wheel saw cut Fig. 9 Backscattering electron image of transverse view of tibia after razor fracture


