Download
1 / 62
620 likes | 681 Views
Lecture 7. Statistical Lecture- Tree Construction. Example. Yale Pregnancy Outcome Study Study subject: women made a first prenatal ( 產檢 ) visit between May 12, 1980, and March, 12, 1980 Total number: 3861 Question: Which pregnant women are most at risk of preterm deliveries?.

E N D
Lecture 7 Statistical Lecture- Tree Construction
Example • Yale Pregnancy Outcome Study • Study subject: women made a first prenatal (產檢) visit between May 12, 1980, and March, 12, 1980 • Total number: 3861 • Question: Which pregnant women are most at risk of preterm deliveries?
Variable Label Type Range/levels ================================================ Maternal age x1 Continuous 13-46 Marital status x2 Nominal Currently married, widowed, never married Race x3 Nominal White, Black, Hispanic, Asian, Others Marijuana use x4 Nominal Yes, no Times of using x5 Ordinal >=5, 3-4, 2, 1 (daily) marijuana 4-6, 1-3 (weekly) 2-3, 1, <1 (monthly) Years of education x6 Continuous 4-27 Employment x7 Nominal Yes, no
Variable Label Type Range/levels =============================================== Smoker x8 Nominal Yes, no Cigarettes smoked x9 Continuous 0-66 Passive smoking x10 Nominal Yes, no Gravidity x11 Ordinal 1-10 Hormones/DES x12 Nominal None, hormones, DES, used by mother both, uncertain Alcohol (oz/day) x13 Ordinal 0-3 Caffeine (mg) x14 Continuous 12.6-1273 Parity x15 Ordinal 0-7
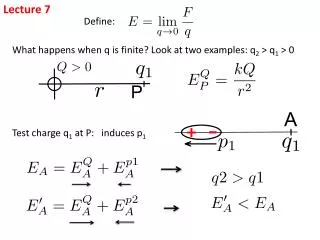
The Elements of Tree Construction (1) • Three layers of nodes • The first layer is the unique root node, the circle on the top • One internal (the circle) node is in the second layer, and three terminal (the boxes) nodes are respectively in the second and third layers • The root node can also be regarded as an internal node
The Elements of Tree Construction (2) • Both the root and the internal nodes are partitioned into two nodes in the next layer that are called left and right daughter nodes • The terminal nodes does not have offspring nodes
Three Questions • What are the contents of the nodes? • Why and how is a parent node split into two daughter nodes? • When do we declare a terminal node?
Node (1) • The root node contains a sample of subjects which the tree is grown • Those subjects constitute the so-called learning sample • The learning sample can be the entire study sample or a subset of it • From our example, the root node contains all 3861 pregnant women
Node (2) • All nodes in the same layer constitute a partition of the root node • The partition becomes finer and finer as the layer gets deeper and deeper • Every node in a tree is a subset of the learning sample
Example (1) • Let a dot denote a preterm delivery and a circle stand for a term delivery • The two coordinates represent two covariates, x1 (age) and x13 (the amount of alcohol drinking) • We can draw two line segments to separate the dots from the circles
Example (2) Three disjoint regions (I) x13 c2 (II) x13>c2 and x1 c1 (III) x13>c2 and x1 >c1 Partition I is not divided by x1, and partition I and II are identical in response but described differently.
Recursive Partitioning (1) • The purpose is that the terminal nodes are homogeneous in the sense that they contain either dots or circles • The two internal nodes are heterogeneous because they contain both dots and circles • All pregnant women older than a certain age and drinking more than a certain amount of alcohol daily deliver preterm infants • This would show an ideal association of preterm delivery to the age and alcohol consumption
Recursive Partitioning (2) • Complete homogeneity of terminal nodes is an ideal • The numerical objective of partitioning is to make the contents of the terminal nodes as homogeneous as possible • Node impurity can indicate the extent of node homogeneity
Recursive Partitioning (3) The closer this ratio is to 0 or 1, the more homogeneous is the node
Splitting a Node • We focus on the root node, since the same process applies to the partition of any node • All allowable splits are considered for the predictor variables • The continuous variables should be appropriately categorized
Example (1) • The variable of age has 32 distinct values in the range of 13 to 46 • It may result in 32-1=31 allowable splits • One split can be whether or not age is more than 35 years (x1>35) • For an ordinal or a continuous predictor, the number of allowable splits is one fewer than the number of its distinctly observed values
Example (2) • There are 153 different levels of daily caffeine intake ranging from 0 to 1273 • We can split the root node in 152 different ways • Splitting nominal predictors are more complicated • Any nominal variable that has k levels contributes 2k-1-1 allowable splits • x3 denotes 5 ethnic groups which will have 25-1-1 allowable splits
Left daughter node Right daughter node White Black,Hispanic,Asian,Others Black White,Hispanic,Asian,Others Hispanic White,Black,Asian,Others Asian White,Black,Hispanic,Others White,Black Hispanic,Asian,Others White,Hispanic Black,Asian,Others White,Asian Black,Hispanic,Others Black,Hispanic White,Asian,Others Black,Asian White, Hispanic,Others Hispanic,Asian White,Black,Others Black,Hispanic,Asian White,Others White,Hispanic,Asian Black,Others White,Black,Asian Hispanic,Others White,Black,Hispanic Asian,Others White,Black,Hispanic,Asian Others
Example (3) • We have 347 possible ways to divide the root into two subnodes from 15 predictors • The total number of the allowable splits is usually not small • How do we select one or several preferred splits? • We must define the goodness of a split
Goodness of a Split (1) • What we want is a split that results in two pure (or homogeneous) daughter nodes • The goodness of a split must weigh the homogeneities (or the impurities) in the two daughter nodes
Goodness of a Split (2) Take age as a tentative splitting covariate and consider its cutoff at c, as a result of the question “Is x1>c?” Term Preterm Left Node (τL) x1≦c n11 n12 n1. Right Node (τR) x1>c n21 n22 n2. n.1 n.2
Goodness of a Split (3) • Let Y=1 if a woman has a preterm delivery and Y=0 otherwise • We estimate P{Y=1|τL}=n12/n1. and P{Y=1|τR}=n22/n2. • The notion of entropy impurity in the left daughter node is
Goodness of a Split (4) • The notion of entropy impurity in the left daughter node is • The impurity in the right daughter node is
Goodness of a Split (5) The goodness of a split, s, is measured by where τ is the parent of τL and τR, and P{τL} and P{τR} are the probabilities that a subject falls into nodes τL and τR.
Goodness of a Split (6) If we take c=35 as the age threshold, Term Preterm Left Node (τL) 3521 198 3719 Right Node (τR) 135 7 142 3656 205 3861
Split Impurity 1000*Goodness value Left node Right node of the split (1000 Δ) • 0.00000 0.20757 0.01 14 0.00000 0.20793 0.14 15 0.31969 0.20615 0.17 16 0.27331 0.20583 0.13 17 0.27366 0.20455 0.23 18 0.31822 0.19839 1.13 19 0.30738 0.19508 1.40 20 0.28448 0.19450 1.15 21 0.27440 0.19255 1.15 22 0.26616 0.18965 1.22
Split Impurity 1000*Goodness value Left node Right node of the split (1000 Δ) 23 0.25501 0.18871 1.05 24 0.25747 0.18195 1.50 25 0.24160 0.18479 0.92 26 0.23360 0.18431 0.72 27 0.22750 0.18344 0.58 28 0.22109 0.18509 0.37 29 0.21225 0.19679 0.06 30 0.20841 0.20470 0.00 31 0.20339 0.22556 0.09 32 0.20254 0.23871 0.18
Split Impurity 1000*Goodness value Left node Right node of the split (1000 Δ) 33 0.20467 0.23524 0.09 34 0.20823 0.19491 0.01 35 0.20795 0.19644 0.01 36 0.20744 0.21112 0.00 37 0.20878 0.09804 0.18 38 0.20857 0.00000 0.37 39 0.20805 0.00000 0.18 40 0.20781 0.00000 0.10 41 0.20769 0.00000 0.06 42 0.20761 0.00000 0.03 43 0.20757 0.00000 0.01
Goodness of a Split (8) • The greatest reduction comes from age split at 24 • It might be more interesting to force an age split at age 19, stratifying the sample into teenagers and adults • This kind of interactive process is fundamentally important in producing the most interpretable trees
Variable 1000*Goodness of the split (1000 Δ) x1 1.5 x2 2.8 x3 4.0 x4 0.6 x50.6 x6 3.2 x7 0.7
Variable 1000*Goodness of the split (1000 Δ) x8 0.6 x9 0.7 x10 0.2 x11 1.8 x121.1 x13 0.5 x14 0.8 x15 1.2
Splitting the Root • The best of the best comes from the race with ΔI=0.004. • The best split divides the root node according to whether a pregnant woman is Black or not • After splitting the root node, we continue to divide its two daughter nodes • The partitioning principle is the same
Second Splitting (node 2) • The partition uses only 710 Black women • The total number of allowable splits decreases from 347 to 332 (minus the race) • After the split of node 2, we have three nodes, 3, 4, and 5 ready to be split
Second Splitting (node 3) • In the same way, we can divide node 3 • We consider only 3151 non-Black women • There are potentially 24-1-1=7 race splits (Whites, Hispanics, Asians, and others) • There are 339 allowable splits for node 3 • After we finish node 3, we go on to nodes 4 and 5 • This is so-called recursive partitioning • The resulting tree is called a binary tree
Terminal Nodes (1) • The partitioning process may proceed until the offspring nodes subject to further division cannot be split (saturated) • For example, when there is only one subject in a node • The total number of allowable splits for a node drops as we move from one layer to the next • The number of allowable splits eventually reduces to zero, and the tree cannot be split any further • Any node cannot be split is a terminal node
Terminal Nodes (2) • The saturated tree is usually too large to be useful, because the terminal nodes are so small • It is unnecessary to wait until the tree is saturated • A minimum size of a node is set a priori. • The choice of the minimum size depends on the sample size (e.g., one percent) or can be simply taken as 5 subjects • Stopping rules should be proposed before the tree becomes too large
Node Impurity • The impurity of a node τ is defined as a nonnegative function of the probability, P{Y=1|τ} • The least impure node should have only one class of the outcome (i.e., P{Y=1|τ}=0 or 1), and its impurity is 0 • Node τ is most impure when P{Y=1|τ}=1/2
Impurity Function (1) The impurity function has a concave shape and can be formally defined as
Impurity Function (2) Common choices of φ include (i) is the Bayes error (the minimum error) (rarely used) (ii) is the entropy function (iii) is Gini index (also has some problems)
Comparison Between Tree-based and Logistic Regression Analyses
Logistic Regression Logistic regression model:
Example (Yale study) Selected Degrees of Coefficient Standard Variable freedom Estimate Error p-value ============================================ Intercept 1 -2.344 0.4584 0.0001 x6 (educ.) 1 -0.076 0.0313 0.0156 z6 (Black) 1 0.699 0.1688 0.0001 x11 (grav.) 1 0.115 0.0466 0.0137 z10 (horm.) 1 1.539 0.4999 0.0021 z6=1 for an African-American, =0 otherwise. z10=1 if a subject’s mother used hormones only, =0 otherwise.