
Coastal Observations Study on DIC Dynamics: Results & Analysis
Explore how diverse variables influence Dissolved Inorganic Carbon in a coastal region through measured flow variables and Kriging interpolation method. Assess the roles of salinity fields, offshore simulations, and biotic processes.
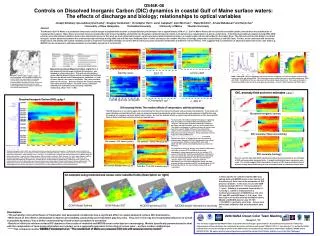

Coastal Observations Study on DIC Dynamics: Results & Analysis
E N D
Presentation Transcript
Measurements (above) Mapped variables: (right) Each of the measured flow-through variables (listed above) was mapped in a time-space grid. This grid was interpolated using a Matlab-based Kriging routine developed by Dezhang Chu and the Woods Hole Oceanographic Institution. In each of these figures, the x-axis is longitude. The y-axis provides dates of the cruises. Discrete samples for surface alkalinity were taken at each station. For each cruise, continuous alkalinity was estimated using a salinity- alkalinity relationship. (Rsq = 0.87 - 0.98) Salinity (psu) pCO2 matm SST oC • 2005 – a wet year: Riverine discharge (summed from the 4 largest rivers influencing the region) to the ocean was very high during 2005. The discharge curves compare the more normal discharge year 2004, with 2005. The effects of this are expressed in the salinity maps shown here. The maps are based on Huijie Xue’s GOM model and show averaged salinity (April – June) for 2004 (middle) and 2005 (right). Our cruise track: The Coastal Ocean Observing Center (UNH), has undertaken (ca.) monthly cruises along cross-shore transect (stars = profiling stations along the transect). Inset gives a regional perspectiveand shows the cruise extent (bottom box) and the region of interest for the satellite study (top box). DIC, anomaly field and error estimates (mg kg-1) Dissolved inorganic Carbon (DIC) mg kg-1 f-DOM (quinine units,ppb) f-Chlorophyll ug l-1 c_660 m-1 DIC anomaly fields: The relative effects of temperature, salinity and biology The DIC dynamics of our study region are controlled by the flux of terrestrial freshwater and associated constituents. Fresh water will impart dilution and solubility effects, and will enhance biological productivity and/or respiration through enhanced stratification and the subsidy of inorganic nutrients and/or labile carbon. Air-sea flux and the effects of calcite (formation/dilution) on the observed DIC fields is likely small (data not shown) and are ignored here. observed estimated Dissolved inorganic carbon To assess the role inshore salinity fields play in regulating DIC, we subtract a simulated DIC field estimated with “offshore” salinity (and associated alkalinity) conditions, but observed pCO2 and SST, from our observed DIC field. The offshore estimates of salinity are taken for each cruise date from a point ~50km offshore of our most distal station, where conditions are presumed to be minimally affected by terrestrial influence. These estimates are from Huijie Xue’s daily GOM model (http://rocky.umeoce.maine.edu/GoMPOM). In similar fashion, the effects of temperature were estimated by subtracting a simulated DIC field (estimated using a fixed cruise-by-cruise offshore modeled SST value with observed SST, salinity and alkalinity) from our observed DIC field. To estimate the effect of biology, we simulate a DIC field in which the in-water pCO2 is fixed to the average atmospheric value measured on all of our cruises (374 matm); while the SST, Salinity and alkalinity are allowed to vary. To produce the anomaly, this product is subtracted from the observed DIC field. Here we assume that an “abiotic” water mass would equilibrate with the atmosphere over the time scales under study. We also assume that the variability in pCO2, not attributable to SST and salinity effects, are due to biotic productivity and respiration. observed estimated DIC anomaly (Temp and salinity) DIC anomaly - SST effects (mg kg-1) DIC anomaly - salinity effects(mg kg-1) Discharge 103 ft3 s-1 observed Dissolved inorganic carbon (DIC) was estimated using the carbonate equilibrium equation. Continuously-measured pCO2 and estimated alkalinity were used as inputs. For these analyses, estimated alkalinity is based on the cruise-by cruise alkalinity-salinity relationship (Rsq=0.87 – 0.98; absolute error 7 mmol kg-1).To estimate DIC, a program was coded by Chris Hunt in Matlab using the following constants: K-borate and sulfate (Dickson, 1990 in Dickson and Goyet, 1994, Chapter 5, p. 14); K-water (Millero (1995) in Dickson and Goyet (1994, Chapter 5, p.18); First and second acidity constants (from Cai and Wang 1998). These data were mapped and interpolated as the continuous variables above. On the left side of the DIC map, a discharge curve is shown. This represents the sum of the following rivers known to influence our study region: Penobscot, Kennebec, Saco and Merrimack. The magnitude of the curve demonstrates the correspondence of discharge to the spatio-temporal distribution of DIC. For the following panels, this field is referred to as “observed” DIC as it was estimated with our direct measurements. estimated DIC anomaly (biology) Here we use the flow data (SST, salinity and optical measurements) as an estimator of DIC and associated anomaly fields. A simple multivariate linear regression was used. The results suggest that reasonable retrievals of DIC and associated control processes may be possible using a suite of modeled and /or remotely-sensed data. DIC anomaly biology effects (mg kg-1) Total (Bio, T & S) DIC anomaly (mg kg-1) An example using modeled and ocean-color satellite fields (description on right) GOM Model Salinity GOM Model SST MODIS-derived pCO2 MODIS/model-derived bio-anomaly 2006 NASA Ocean Color Team Meeting Newport, RI This work was supported by NASA's Office of Earth Sciences through a grant entitled "A satellite-based system for monitoring biogeochemical fluxes between the continental land mass and the coastal ocean" (NAG5-12451, C. Vorosmarty, P.I.), and by the NOAA Coastal Services Center through an award to the UNH Center for Coastal Ocean Observation and Analysis (COOA). (NOAA award NA16OC2740). We appreciate the help and guidance provided by captain Paul Pelletier and the crew of the Gulf Challenger OS46K-08Controls on Dissolved Inorganic Carbon (DIC) dynamics in coastal Gulf of Maine surface waters: The effects of discharge and biology; relationships to optical variablesJoseph Salisbury (joe.salisbury@unh.edu)1, Douglas Vandemark1, Christopher Hunt1, Janet Campbell1, John Morrison1 , Wade McGillis2, Amala Mahadavan4 and Huijie Xue31University of New Hampshire 2Columbia University 3University of Maine 4Boston University Abstract: The Western Gulf of Maine is a productive temperate coastal margin ecosystem that receives a substantial annual freshwater flux of approximately 2000 m3 s-1. Gulf of Maine Rivers deliver nutrients and labile carbon, and enhance the stratification of coastal surface waters. These fluxes are known to have considerable inter-annual variability, and yet the role they play in productivity and carbon cycle dynamics in coastal waters is poorly understood. A monthly observational program during 2004-2006 provides new information to address land-ocean interaction issues. In this work we track dissolved inorganic carbon and associated metabolic proxies in a coastal region influenced by Maine's Kennebec River. The data set provides the ability to contrast inorganic carbon dynamics between the anomalously high discharge during 2005 and with the more moderate flow of 2004, and assess the relative influence of biology, temperature and salinity on the DIC fields. Further, when combined with measured temperature and salinity, the optical variables provide a means for reasonable estimates of surface DIC and the presumed anomalies attributable to different riverine effects. This suggests that a combination of physical models and ocean color data (e.g. MODIS) can be employed to estimate metabolic and solubility dynamics of surface DIC. In these panels we combine modeled SST and salinity data with MODIS ocean color data to test the efficacy of their use for the estimation of DIC process variables. In this case we use the GOM model to estimate SST (+/- 1oC) and salinity (+/- 1.1 psu). Alkalinity is estimated from salinity (+/- 7mmol kg-1). pCO2 is estimated from a multivariate regression of MODIS nLw 412, 443, 551 and 667 and K490 data (+/- 9.8 matm). See description of the bio-anomaly estimation above. (Model and MODIS data for was 3/17/05 (~10:00EST), a perfectly clear day). Future work will include validation with an independent data set. Conclusions: - The variability in terrestrial fluxes of freshwater and associated constituents has a significant effect on spatio-temporal surface DIC distributions. - While much of this effect is attributable to dilution and solubility, productivity and respiration play key roles. Thus, the rivers may exert substantial influence in overall ecosystem dynamics, thus a better understanding of land-ocean ecosystem is warranted. - Results of efforts to retrieve surface DIC dynamics from a suite of modeled and MODIS ocean color data are encouraging. Models specifically parameterized to deal with the complexities of land-ocean interaction are needed, as is a systematic approach to the study of ocean color – surface carbon relationships. ****** See companion poster OS35G-1 Vandemark et al.“The coastal Gulf of Maine as a seasonal CO2 sink with seasonal riverine control”