Understanding the Behavior of Disappearing Peaks in Spectroscopy Analysis
20 likes | 125 Views
This article delves into the phenomenon of disappearing peaks in spectroscopy analysis, discussing the mathematical and physical considerations behind the results. It explores the reasons behind the disappearance and increase of peaks, as well as the implications of asymmetry in spectral data.

Understanding the Behavior of Disappearing Peaks in Spectroscopy Analysis
E N D
Presentation Transcript
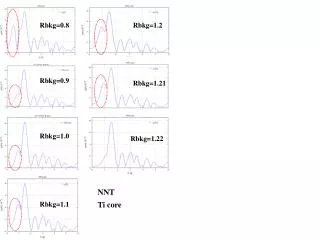
Rbkg=0.8 Rbkg=1.2 Rbkg=0.9 Rbkg=1.21 Rbkg=1.0 Rbkg=1.22 NNT Rbkg=1.1 Ti core
Q1: The first pick disappear from Rbkg=0.8 to Rbkg=0.9, how to decide this result, did it have math or physical consideration with the Rbkg result? Rbkg=1.2 Rbkg=0.8 Q2: Following Q1, the first pick increase from Rbkg=1.0 to Rbkg=1.21, and disappear at Rbkg=1.22, why did it increase? Rbkg=0.9 Rbkg=1.21 Q3: For Rbkg=1.22 case, we get un-symmetry spectrum, is it normal? Or perhaps it come from the un-symmetry structure contribution? Rbkg=1.0 Rbkg=1.22 NTT Rbkg=1.1 Ti core