Download
1 / 1
10 likes | 159 Views
Micro-Flare and High-Speed Down-Flow observed with VTT. 13:36:34. 13:17:26. Scan direction. 0. 4. 8. 12. 16. 20. 24. C. B5.4 flare in VTT FOV. Time (UT) : 2005/07/09. C. A. B. A. B. VTT. STT H a. EIT 195. 13:25:58. 10789. 10786. 10783. 10788. 10789.

E N D
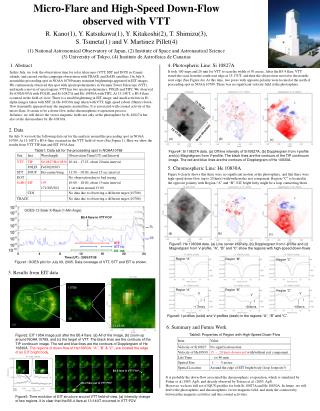
Micro-Flare and High-Speed Down-Flow observed with VTT 13:36:34 13:17:26 Scan direction 0 4 8 12 16 20 24 C B5.4 flare in VTT FOV Time (UT) : 2005/07/09 C A B A B VTT STT Ha EIT 195 13:25:58 10789 10786 10783 10788 10789 B5.4 flare in VTT FOV B4.2 flare out of VTT FOV R. Kano(1), Y. Katsukawa(1), Y. Kitakoshi(2), T. Shimizu(3), S. Tsuneta(1) and V. Martinez Pillet(4) (1) National Astronomical Observatory of Japan, (2) Institute of Space and Astronautical Science (3) University of Tokyo, (4) Instituto de Astrofísica de Canarias 4. Photospheric Line: Si 10827A 1. Abstract It took 100 steps and 20 min for VTT to scan the width of 30 arcsec. After the B5.4 flare, VTT stared the scan from the south-east edge at 13:17UT, and then the slit position moved to the nourth-west edge (See Figure 4a). At this time, two pores with opposite polarity were located at the north of proceeding spot in NOAA 10789. There was no significant velocity field at the photosphere. In this July, we took the observation time for solar telescopes (VTT, SST and DOT) in Canary islands, and carried out the campaign observation with TRACE and SoHO satellites. On July 9, around the proceeding spot in NOAA 10789 many transient brightenings appeared in EIT images. We continuously observed this spot with spectropolarimeters in Vacuum Tower Telescope (VTT), and made a movie of spectrogram. VTT has two spectropolarimeters, POLIS and TIP2. We observed Fe-6302/6303A with POLIS, and Si-10827A and He-10830A with TIP2. At 13:14UT, a B5.4 flare occurred in the field-of-view. There is a small brightening in EIT image, and small activities in H-alpha images taken with SST. In He-10830A map taken with VTT, high speed (about 20km/s) down-flow transiently appeared near the magnetic neutral line. It is associated with coronal activity of the micro-flare. It seems to be a down-flow in the chromospheric evaporation process. In future, we will derive the vector magnetic fields not only at the photosphere by Si-10827A but also at the chromoshere by He-10830A. 2. Data On July 9, we took the following data set for the analysis around the preceeding spot in NOAA 10789. At 13:14UT a B5.4 flare occurred in the VTT field-of-view (See Figure 1). Here we show the results from VTT TIP data and EIT 195A data. (a) (b) (c) Table1: Data set for the proceeding spot in NOAA10789 Figure4: Si 10827A data. (a) Off line intensity of Si10827A, (b) Dopplergram from I-profile and (c) Magnetgram from V-profile. The black lines are the contours of the TIP continuum image. The red and blue lines are the contours of Dopplergram of He 10830A. 5. Chromospheric Line: He 10830A Figure 6 clearly shows that there were no significant motion at the photosphere, and that there were high-speed down-flow (up to 20 km/s) with/without the rest component. Region-“C” is located in the opposite polarity with Region-“A” and “B”. EIT bright boby might be a loop connecting them. (a) (b) (c) Figure5: He 10830A data. (a) Line center intensity, (b) Dopplergram from I-profile and (c) Magnetgram from V-profile. “A”, “B” and “C” show the regions with high-speed down-flows. Region “A” Region “B” Region “C” Figure1: GOES plot for July 09, 2005. Data coverage of VTT, STT and EIT is shown. 3. Results from EIT data 3. Discussion Region “A” Region “B” Region “C” V V V I I I ~17km/s ~20km/s ~15km/s Figure6: I-profiles (solid) and V-profiles (dash) in the regions “A”, “B” and “C”. (b) (c) (a) 6. Summary and Future Work Table2: Properties of Region with High-Speed Down-Flow Figure2: EIT 195A image just after the B5.4 flare. (a) All of the image, (b) zoom-up around NOAA 10789, and (c) the target of VTT. The black lines are the contours of the TIP continuum image. The red and blue lines are the contours of Dopplergram of He 10830A. The regions of down-flow of He10830A, “A”, “B” & “C”, are located the edge of an EIT bright body. It is probably the down-flow associated the chromospheric evaporation, which is simulated by Fisher et al (1985, ApJ), and already observed by Teriaca et al. (2003, ApJ). However, we have full set of IQUV-profiles for both Si-10827A and He 10830A. In future, we will derive the photospheric and chromospheric vector magnetic field, and study the connectivity between the magnetic activities and the coronal activities. (b) (a) Figure3: Time evolution of EIT structure around VTT field-of-view. (a) Intensity change of two regions. It is clear that the B5.4 flare at 13:14UT occurred in VTT-FOV.