Download
1 / 23
230 likes | 327 Views
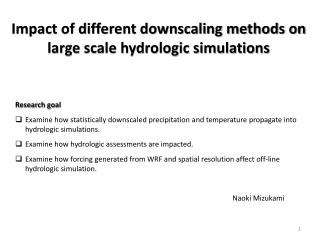
Publication of a large-scale hydrologic data set using the SDSC SRB. NPACI All Hands Meeting March 19, 2003 Edwin P. Maurer University of Washington Departments of Civil and Environmental Engineering and Atmospheric Sciences. Public Interest in Hydrologic Variability. Droughts.

E N D
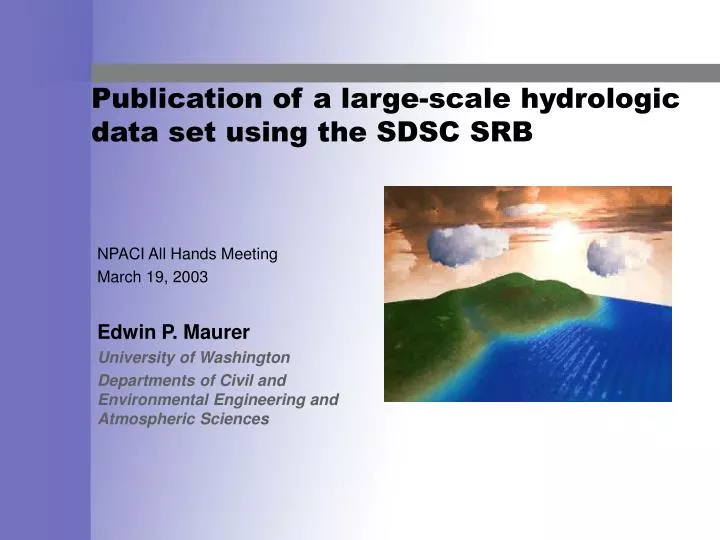
Publication of a large-scale hydrologic data set using the SDSC SRB NPACI All Hands Meeting March 19, 2003 Edwin P. Maurer University of Washington Departments of Civil and Environmental Engineering and Atmospheric Sciences
Public Interest in Hydrologic Variability Droughts $6-8 billion/yr Extreme Events Floods $5 billion/yr Source: NOAA, Hydrologic Info. Ctr.
Prospects for Future Forecast for Future: Deluge or Drought “floods and droughts…will become increasingly common as the world grows warmer” – NYT, 8/28/2002 “effects…include increases in rainfall rates and increased susceptibility of semiarid regions to drought.” – U.S. Climate Action Report, 2002
Motivation for Development of Hydrologic Dataset • Large and growing costs imply potential societal benefit to predictability • Better observation and prediction of climate signals and their teleconnections to land areas increases predictive skill • Improved understanding of continental-scale hydrologic variability through data collection and modeling
Understanding the Land-Surface Water Budget Examine variability in water budget components E P (Near Surface) Water Balance Equation W Q Need long records of observations to define variability and predictability
Precipitation and Evaporation Observations Precipitation appears well defined, generally since 1948 Ameriflux (flux towers) provides measurements of E, since mid 1990’s U.S. Station density: 1 per 700 km2 U.S. Station Density: 1 per 130,000 km2
Snow Water and Soil Moisture Observations • About 600 SNOTEL sites in western US • Snow water content measured since 1977 • Spatial coverage poor at continental scale Source: A. Robock, Rutgers U.
Runoff (Streamflow) Observations • Streamflow in the U.S. measured at roughly 7,000 active gauging stations. • Stations represent regulated flow conditions • Streamflow is a spatially integrated quantity Source: U.S.G.S.
Need for Modeling Variability of water budget components cannot be determined with observations • To derive W and E, use P (and T) to drive a hydrologic model • Reproduce observed Q • By water balance, E must be close • Physically-based land surface representation can provide information on variability
Hydrologic Model • VIC Model Features: • Developed over 10 years • Energy and water budget closure at each time step • Multiple vegetation classes in each cell • Sub-grid elevation band definition (for snow) • Subgrid infiltration/runoff variability
Use of Existing GIS Products Soil parameters: derived from Penn State State STATSGO in the U.S., FAO global soil map elsewhere. Land Cover/Vegetation: from the University of Maryland 1-km Global Land Cover product (derived from AVHRR)
Production of the Hydrologic Dataset Using VIC model, simulation run for 50 years at 3-hour time step Input Time series of spatial data One terabyte of output archived
Derived Data Set Characteristics • 50-years • 3-hour time step • 1/8 degree (~12 km) resolution • 77,000 grid cells through domain • Variables include all water and energy budget components • Long term spatial data set allows characterization of variability
Use and Sharing of the Dataset • The database allowed the in-house investigation of predictability of runoff, resulting in several journal articles. • Currently updating dataset. • Ongoing use at the University of Washington, using SRB as permanent storage site. • This unique dataset is of interest to many others in Climate modeling, Forecasting, and Hydrologic Modeling communities.
Data Storage and Access • Storage challenge: • Each File (3-hourly) ~500MB (compressed) • 19 variables x 51 years=969 files • ~500GB space needed for 3-hourly files (+ 80GB for daily). • netCDF format used (compression to 2-D) • Desired ftp-type storage • Discovered (by word of mouth) that SDSC SRB could provide a storage system for: • Large storage space for archiving data • Permanent space allocation • Accessible location for other users
Storing the Dataset • Uploading files – first began investigating SDSC SRB in late 2001. Our local system limitations required postprocessing in 4 stages. • PC-based software problematic (SRB Browser, later replaced by InQ), esp. for multiple file transfers and using PC/UNIX network interface. • Installation and use of UNIX utilities worked better. Understanding “containers” “collections” etc. outside of “ftp” mentality – learning curve. • Final uploading required assistance, generously provided by SDSC personnel. Subsequent updating has gone smoothly with minimal outside assistance.
Retrieving Data from the Collection • As with uploading, early PC-based software problematic • Later InQ better, but PC-based retrieval restricted usability (large file sizes, saving across networks) • Browser-based mySRB good for examining archive but not functional for downloading files • UNIX utilities allow scripting for accessing multiple variables and years. • This is how the data is almost always used.
Geographic Distribution of Users • On-line (voluntary) registration form records many users • Since the publication of the journal article in November 2002, over 40 unique users have registered.
Precipitation/Land Cover Experiment Differing VIC soil moisture fields used to initialize a mesoscale atmospheric model over Florida Shows changes in precipitation due to soil moisture and vegetation (Marshall et al. 2002, Colorado State Univ.)
Regional Application of the dataset • Paucity of land surface observations for validating weather prediction and climate models. • VIC model output used as “pseudo-observations” • This graphic from a study headed at UCSC/Scripps (Roads et al., 2002)
Use in Diagnosing Climate Model Bias Betts at al (2003) studied the annual cycle of the land surface water and energy balance over the Mississippi River basin. Assessed the systematic biases in the surface energy and water budgets of NASA-DAO atmospheric general circulation model and ECMWF reanalysis (ERA-40). Used the current dataset as benchmark measurements for assessing model biases.
Summary and Future Plans • The SDSC SRB has provided a valuable service to this project and the hydrologic community, allowing the permanent storage and sharing of our data set with other researchers. • As software improved and we gained experience in retrieving data, users from many disciplines have been able to successfully access the data. • Future data set development will benefit from this experience, to provide: • Better file formats for selective downloading • Smaller files for ease of use