Download
1 / 125
1.25k likes | 1.39k Views
SE 325/425 Principles and Practices of Software Engineering Autumn 2006. James Nowotarski 24 October 2006. Today’s Agenda. Topic Duration Planning and metrics recap 20 minutes Analysis modeling 60 minutes *** Break Current event reports 20 minutes

E N D
SE 325/425Principles and Practices of Software EngineeringAutumn 2006 James Nowotarski 24 October 2006
Today’s Agenda Topic Duration • Planning and metrics recap 20 minutes • Analysis modeling 60 minutes *** Break • Current event reports 20 minutes • Analysis modeling (cont.) 30 minutes • Design modeling 30 minutes
People trump process “A successful software methodology (not new, others have suggested it):(1) Hire really smart people(2) Set some basic direction/goals(3) Get the hell out of the wayIn addition to the steps about, there's another key: RETENTION” http://steve-yegge.blogspot.com/2006/09/good-agile-bad-agile_27.html
requirements Users Negotiate reqts work breakdown structure negotiated requirements Decom- pose productivity rate Estimate size deliverable size Estimate resources 5 3 4 2 1 workmonths Develop schedule Iterate as necessary schedule Planning process
Work Breakdown Structure • Breaks project into a hierarchy. • Creates a clear project structure. • Avoids risk of missing project elements. • Enables clarity of high level planning.
requirements Users Negotiate reqts work breakdown structure negotiated requirements Decom- pose Estimate size deliverable size Estimate resources 4 5 3 2 1 workmonths Develop schedule Iterate as necessary schedule Planning process productivity rate
Units of Size • Lines of code (LOC) • Function points (FP) • Components
Computing Function Points 5 15 8 32 10 40 8 80 2 10 177
Components Criteria: Simple – Medium – Hard –
Project Management Planning & Managing Communication project initiation requirements Modeling analysis design Construction code test Deployment delivery support top down estimating bottom up estimating
Empirical Estimation Models • Empirical data supporting most empirical models is derived from a limited sample of projects. • NO estimation model is suitable for all classes of software projects. • USE the results judiciously. • General model: E = A + B X (ev)cwhere A, B, and C are empirically derived constants.E is effort in person monthsev is the estimation variable (either in LOC or FP)
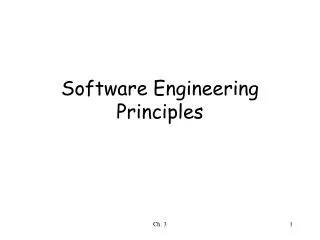
Be sure to include contingency The earlier “completed programs” size and effort data points in Figure 2 are the actual sizes and efforts of seven software products built to an imprecisely-defined specification [Boehm et al. 1984]†. The later “USAF/ESD proposals” data points are from five proposals submitted to the U.S. Air Force Electronic Systems Division in response to a fairly thorough specification [Devenny 1976]. http://sunset.usc.edu/research/COCOMOII/index.html
requirements Users Negotiate reqts work breakdown structure negotiated requirements Decom- pose Estimate size deliverable size Estimate resources 4 5 3 2 1 workmonths Develop schedule Iterate as necessary schedule Planning process productivity rate
GANTT Schedule • View Project in Context of time. • Critical for monitoring a schedule. • Granularity 1 –2 weeks.
Objectives of Software Measurement • Help a systems development unit understand their performance • Evaluate performance relative to goals • Allow for comparisons to, e.g.,: • Other organizations • Alternative development approaches (custom, packaged, outsourced, etc.) and technologies • Other standards/targets • Improve estimating ability • Promote desired behaviors, e.g., reuse
What is the quality of our deliverables? How predictable is our process? How quickly do we deliver? How efficient are we? Fault density Delivery rate Productivity rate Duration variance percentage GQM Example (High Level) Goal Improve systems delivery performance Question Metric
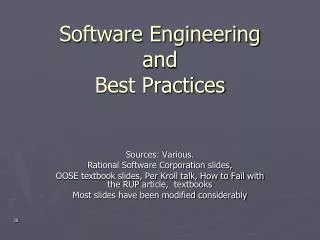
= Is a single project release (Average elapsed months =14.8, n=33). Industry Average line is determined from Software Productivity Research Example: Speed of delivery 70 60 50 40 Elapsed Months 30 20 10 0 0 2000 4000 6000 8000 10000 12000 Developed Function Points
Example: Schedule reliability 60% 50% 40% 30% Schedule Variance above commitment 20% = Is a single project release (n=33). Industry Average line is determined from Software Productivity Research 10% 0% 2000 4000 6000 8000 10000 12000 Developed Function Points
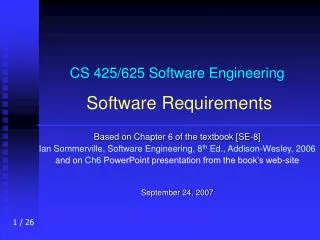
Faults reported over the first three months in operations (n=27) An estimated industry average for faults found in the first three months of operations. The assumption is that half the total faults are found in the first three months in operation. This average is one half of the industry average of the total faults from C. Jones, Applied Software Measurement, 1996, p.232. Example: Software quality 7000 6000 5000 4000 3000 Faults (3 months) 2000 1000 0 0 2000 4000 6000 8000 10000 12000 Developed Function Points
Example: Productivity 12 10 8 Is a single project release (n=33) Industry Average line is determined from Software Productivity Research. 6 Function Points per Staff Month 4 2 0 0 2000 4000 6000 8000 10000 12000 Developed Function Points
Measurement and Continuous Improvement Continuous Improvement Measurement
Continuous Process Improvement Approach to Quality and Measurement 1. Identify performance standards and goals Plan 2. Measure project performance 4. Eliminate causes of deficient performance - fix defects - fix root causes Act Do Check 3. Compare metrics against goals
Achieve-2 Sustain Enable Achieve-1 Change Change Change Change Metrics Strategy Commitment / Ownership Metrics Rollout Education/Training Ongoing Metrics Education / Training Roles & Responsibilities Metrics Network Large Project Network Metrics Awareness Education Pilot Project Group Distributed Support Units System Building Improvement Goals Dashboard metrics Implementation Vital Few Metrics Definitions Vital Few Metrics Implementation Measurement Process Definition Measurement Process Improvement Metrics Definition & Implementation for Delivery Centers Technology Strategy Metrics Repository and tools KM Support for Measurement Community of Practice Metrics Programs Need to Address People, Process, Technology Enable Large Projects and Remaining Centers Pilot Selected Projects and Selected Delivery Centers People Process Metrics Embedded in System Building Methods Technology QUALITY MANAGEMENT PROGRAM MANAGEMENT
Most metrics programs fail within first 2 years Reasons • Lack of [visible] executive sponsorship • Lack of alignment with organizational goals • Tendency to collect too much data • Measures not calibrated, normalized, or validated • Not comparing apples-to-apples • Fear of [individual] evaluation • Learning curve (e.g., function points) • Cost overhead
Key Success Factors • Ensure that measurement is part of something larger, typically performance improvement • “Trojan Horse” strategy • Ensure alignment with organizational goals • Start small, iterate • Strongly recommend doing a pilot test • Automate capture of metrics data • Rigorously define a limited, balanced set of metrics • “Vital Few” • Portfolio approach • Comparability • Aggregate appropriately • Focus should be on processes, not individuals • Obtain [visible] executive sponsorship • Understand and address the behavioral implications
Other Quotes “Count what is countable, measure what is measurable, and what is not measurable, make measurable” Galileo
Other Quotes “In God we trust – All others must bring data” W. Edwards Deming
Some Courses at DePaul • SE 468: Software Measurement and Estimation • Software metrics. Productivity, effort and defect models. Software cost estimation. PREREQUISTE(S):CSC 423 and either SE 430 or CSC 315 or consent • SE 477: Software and System Project Management • Planning, controlling, organizing, staffing and directing software development activities or information systems projects. Theories, techniques and tools for scheduling, feasibility study, cost-benefit analysis. Measurement and evaluation of quality and productivity. PREREQUISTE(S):SE 465 or CSC 315
Today’s Agenda Topic Duration • Planning and metrics recap 20 minutes • Analysis modeling 60 minutes *** Break • Current event reports 20 minutes • Analysis modeling (cont.) 30 minutes • Design modeling 30 minutes
Context Planning & Managing Communication project initiation requirements Modeling analysis design Construction code test Deployment delivery support elicitation Requirements engineering tasks (Ch. 7-8) elaboration specification analysis model software reqts spec Primary deliverables functional reqts non-functional reqts
Use case often first part of analysis model to be developed Planning & Managing Communication project initiation requirements Modeling analysis design Construction code test Deployment delivery support elicitation Requirements engineering tasks (Ch. 7-8) elaboration specification refined use cases Use case deliverables preliminary use cases
Use cases • A user scenario • A thread of usage • Tells a story of an actor (end user or device) interacting with the system
Use case description – narrative “If I’m at a remote location, I can use any PC with appropriate browser software to log on to the SafeHome Products Web site . . . “ Use-case: Activate the system
Use case description – ordered sequence • The homeowner observes . . . • The homeowner uses the keypad . . • The homeowner selects and keys in stay or away . . . • When activation occurs . . . Use-case: Activate the system
Use case description - template Use-case: ActivateSystem Actor: Homeowner Pre-conditions: Trigger: Scenario: Exceptions: . . . Use-case: Activate the system
Analysis model • Combination of text and diagramming • Depicts requirements: • Data • Function • Behavior
Key Definitions • A data model is a • Formal representation of the data to be used for a business system. • A data model should illustrate: • The people, places and things about which data is collected, • And how they are related to each other
Data Modeling A logical data model deliverable includes an ERD and descriptions of entities, attributes, and relationships • Entity-relationship diagram (ERD) • Entity descriptions • Attribute descriptions • Relationship descriptions Components of a Logical Data Model
Entities and Instances Instances are occurrences of an entity
Examples of Attributes • Entity: Person • Attributes: • first_name • last_name • eye_color • date_of_birth • address • Entity: Classroom • Attributes: • room_no • max_capacity
Depicting Entities, Attributes and Identifiers Entity name Identifier Or, use cd_id (PK) Attributes
Identifiers • An identifier should have the following characteristics: • Its value should not change over the life of each instance • Its value should never be “null” or empty • It should be composed of the minimal number (preferably one) of attributes required to ensure uniqueness
Relationshipsrepresent connections, links, or associations between entities e.g., Patient-Appointment Relationships have some important properties: Names, that should be active verbs (A patient schedules appointments) Cardinality Modality. Relationships
Cardinality: Implies that an employee is assigned to only one department. Cardinality: Implies that there may be many employees in a department Modality: Mandatory implies that an employee MUST be assigned to a department Modality: Optional implies that there may be a situation in which a department has no employees. Cardinality and Modality Department Employee contains is assigned to There are several other ERD notations, unfortunately there is no single standard!
Sample Notation Cardinality MinMax 0 1 1 1 0 M[any] 1 M[any]
Cardinality refers to the number of times instances in one entity can be related to instances in another entity One instance in an entity refers to one and only one instance in the related entity (1:1) One instance in an entity refers to one or more instances in the related entity (1:M) One or more instances in an entity refer to one or more instances in the related entity (M:M) Cardinality
ModalityIndicates whether a particular data object MUST participate in the relationship. Modality = 0: No particular need for the relationship. Modality = 1: Relationship is mandatory refers to the minimum number of times that an instance in one entity can be related to an instance in another entity One means that the relationship is mandatory Zero means the relationship is optional Modality
An ERD Example A Vendor must sell at least 1 CD