Download
1 / 26
260 likes | 308 Views
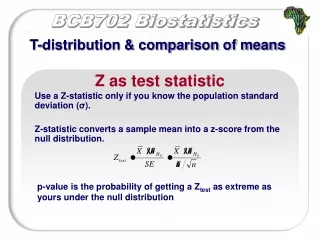
T-distribution & comparison of means. Z as test statistic. Use a Z-statistic only if you know the population standard deviation ( σ ). Z-statistic converts a sample mean into a z-score from the null distribution. .

E N D
T-distribution & comparison of means Z as test statistic Use a Z-statistic only if you know the population standard deviation (σ). Z-statistic converts a sample mean into a z-score from the null distribution. p-value is the probability of getting a Ztest as extreme as yours under the null distribution
s sx= x= n n T-distribution & comparison of means t as a test statistic t-test: uses sample data to evaluate a hypothesis about a population mean when population stdev () isunknown We use the sample stdev (s) to estimate the standard error estimated standard error standard error
Random variable Random variable constant constant (normal) (normal) constant Random variable (non-normal) T-distribution & comparison of means t distribution You can use s to approximate σ, but then the sampling distribution is a t distribution instead of a normal distribution Why are Z-scores normally distributed, but t-scores are not?
T-distribution & comparison of means t distribution Very large sample - estimated standard error almost = the true standard error (t almost exactly the same as Z) t distribution is a family of curves. As n gets bigger, t becomes more normal. For smaller n, the t distribution is platykurtic (narrower peak, fatter tails) Use “degrees of freedom” to decide which t curve to use. Basic t-test, df = n-1
T-distribution & comparison of means t distribution Level of significance for a one-tailed test tcrit
T-distribution & comparison of means Practice with Table B.3 With a sample of size 6, what are the degrees of freedom? For a one-tailed test, what is the critical value of t for an alpha of .05? And for an alpha of .01? Df = 5, tcrit = 2.015; tcrit = 3.365
T-distribution & comparison of means Practice with Table B.3 For a sample of size 25, doing a two-tailed test, what are the degrees of freedom and the critical value of t for an alpha of .05 and for an alpha of .01? Df = 24, tcrit = 2.064; tcrit = 2.797
T-distribution & comparison of means Practice with Table B.3 You have a sample of size 13 and you are doing a one-tailed test. Your tcalc = 2. What do you approximate the p-value to be? p-value between .025 and .05 What if you had the same data, but were doing a two-tailed test? p-value between .05 and .10
T-distribution & comparison of means Two-sample testing All the inferential statistics we have considered involve using one sample as the basis for drawing conclusion about one population. Most research studies aim to compare of two (or more) sets of data in order to make inferences about the differences between two (or more) populations. What do we do when our research question concerns a mean difference between two sets of data?
T-distribution & comparison of means Two-sample testing Steps for Calculating a Test Statistic: Ho: 1 -2 = 0 HA: 1 - 2 0 To test the null hypothesis – compute a t statistic and look up in Table B.3
General t formula t = sample statistic - hypothesized population parameter estimated standard error T-distribution & comparison of means Two-sample testing Steps for Calculating a Test Statistic:
One Sample t Remember? For two-sample test T-distribution & comparison of means Two-sample testing Steps for Calculating a Test Statistic:
T-distribution & comparison of means Two-sample testing Steps for Calculating a Test Statistic: Standard Error for a Difference in Means The one-sample standard error ( sx ) measures how much error expected between X and . The two sample standard error (sx1-x2) measures how much error is expected when you are using a sample mean difference (X1 – X2) to represent a population mean difference.
T-distribution & comparison of means Two-sample testing Steps for Calculating a Test Statistic: Standard Error for a Difference in Means
T-distribution & comparison of means Two-sample testing Steps for Calculating a Test Statistic: Each of the two sample means - there is some error. Calculate the total amount of error involved in using two sample means - find the error from each sample separately and then add the two errors together.
T-distribution & comparison of means Two-sample testing Steps for Calculating a Test Statistic: Standard Error for a Difference in Means BUT: Only works when n1 = n2
T-distribution & comparison of means Two-sample testing Steps for Calculating a Test Statistic: Change the formula slightly - use the pooled sample variance instead of the individual sample variances. Pooled variance = weighted estimate of the variance derived from the two samples.
T-distribution & comparison of means One-Sample T Calculate sample mean Calculate standard error Calculate T and d.f. Use Table B.3
Calculate X1-X2 d.f. = (n1 - 1) + (n2 - 1) T-distribution & comparison of means Two-Sample T Calculate pooled variance Calculate standard error Calculate T and d.f. Use Table B.3
T-distribution & comparison of means SUMMARY OF EQUATIONS