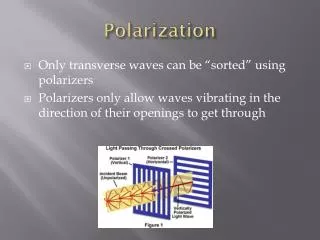
Download
1 / 30
300 likes | 321 Views
This paper discusses the use of polarization technology in analyzing ocean color data from MODIS for estimating phytoplankton concentration. It covers the chlorophyll-a algorithm, wavelengths used for chlorophyll-a estimation, and the impact of misinterpretation on global water-leaving radiance. The study also presents calibration changes and limitations in MODIS-Terra, as well as sun glint corrections and vicarious TOA calibration.

E N D
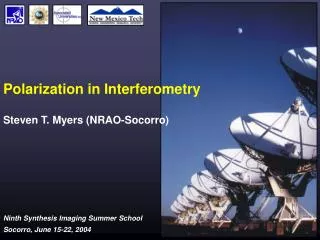
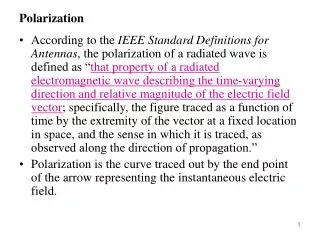
Polarization analysis in MODIS Gerhard Meister, Ewa Kwiatkowska, Bryan Franz , Chuck McClain Ocean Biology Processing Group 18 June 2008 Polarization Technology and Resources for Earth Science Missions
Quantifying Phytoplankton from Space: Chl-a Algorithm Chlorophyll-a CH3 Wavelengths used for Chl-a 0.01 From chlorophyll absorption to chlorophyll concentration via optics Chlorophyll Algorithm: Statistical “Band-Ratio” Regression Reflectance 10 [Chl] mg/m3 Turbid Water SeaWiFS Wavelength (nm) Marine Spectral Reflectance vs. Chlorophyll-a log Clear Water Reflectance Ratio
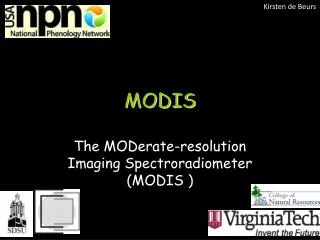
MODIS Optics System +/-55deg scan angles Page 3
MODIS Prelaunch Characterization PSA Issue: 4-cycle effect Solid=2 cycle, dashed=4 cycle
MODIS Prelaunch Characterization Documentation Issues • MODIS requirements were for polarization amplitude and accuracy • The characterization team (SBRS) did not know that the phase was important, orientation of test equipment relative to MODIS not documented • Incorrect interpretation of setup lead to 2+ years of production of erroneous ocean color data
Effect of misinterpretation on global water-leaving radiance
This picture (based on Gene Waluschka’s notes and inquiries) cleared it up: Lesson: Document setup well, words are not enough Note: Direction of PSA rotation still not 100% resolved, implemented based on best agreement with SeaWiFS and most-likely SBRS setup
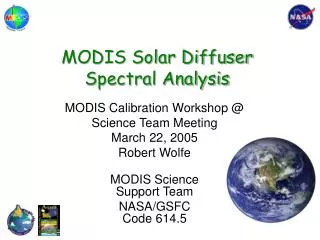
MODIS-Terra cross-calibrationfor ocean color bands Ewa Kwiatkowska Bryan Franz, Gerhard Meister Ocean Biology Processing Group 13 May 2008 MODIS Science Team Meeting
MODIS calibration changes since launch band 8 412nm SD – Solar Diffuser frame 979, mirror AOI 50.30 SV – Space View frame 23, mirror AOI 11.40 MS1 – Mirror Side 1 MS2 – Mirror Side 2 B side electronics pre-launch damage to mirror coating, MS2 Terra SD door permanently opened A side electronics
MODIS trends in ocean color products Terra/Aqua ratios normalized water-leaving radiances Lwn Lwn(412nm) band 8 Lwn(443nm) band 9 Lwn(488nm) band 10 Lwn(531nm) band 11 Lwn(551nm) band 12 SD door permanently opened
MODIS-Terra ocean color RVS band 8 412nm Terra response versus scan angle (RVS) in terms of normalized water-leaving radiances Lwn Lwn(412nm) band 8 Mirror side 1 MS1 Mirror side 2 MS2 +10% -10% per detector
Issues and limitations with MODIS-Terra • Temporal and scan-dependent trend in Lwn of MODIS-Terra suggests • instrument RVS may be in error • polarization sensitivity may be changing • on-board calibration capabilities may be degrading (SD, SDSM) • On-board calibration (lunar or solar) CANNOT assess • changes in RVS “shape” • changes in polarization sensitivities • OBPG developed a vicarious approach for on-orbit characterization of Terra • RVS, and • polarization sensitivity
Surface Effects Sun Glint Corrections based on statistical models (wind & geometry) White Caps
Lt Qt Ut 0 Modeling of TOA Stokes vector over oceans air whitecap glint gas aerosol water Lt(λ) = [ Lr(λ) + La(λ) + tLf(λ) + TLg(λ) + td(λ)Lw(λ) ] · tg(λ) from MODIS NIR assumes MCST NIR band characterization λ’ → λ fit based on bio-optical models SeaWiFS 9-day mean Lwn(λ’)
Lm Qm Um 0 Lt Qt Ut 0 M11 M12 M13 M14 M21 … M24 M31 … M34 M41 M42 M43 M44 = · Vicarious TOA MODIS total signal Lm(λ) = M11Lt(λ) + M12Qt(λ) + M13Ut(λ)
TOA sensor cross-calibration MODIS measured TOA radiance, polarized m Lm(λ) – M11Lt(λ) + M12Qt(λ) + M13Ut(λ) • minimize over global distribution of path geometries • find best M11, M12, M13 per band, detector, and mirror-side • M11, M12, M13 = f (mirror AOI) • do this for one day per month over the mission lifespan
Polarization of the atmosphere √Qt2 + Ut2 dp = Lt degree of atmospheric polarization dp air molecule (Rayleigh) and glint scattering polarization correction fp pre-launch MODIS characterization MODIS Terra swath 412nm band 8 Lm fp = Lt
Blue band temporal trends Mirror side 1 Mirror side 2 RVS = 1/M11 412 Detector 4 443 Space View (lunar) frame Nadir frame Solar Diffuser frame 488
Verification of the vicarious cross-calibration with lunar measurements band 8 412nm Terra detector ratios detector 10 / detector 1 • lunar measurements — vicarious cross-cal 412nm band 8 Mirror side 1 MS1 Mirror side 2 MS2
Blue band temporal trends Mirror side 1 Mirror side 2 M12 412 Detector 4 443 Space View (lunar) frame Nadir frame Solar Diffuser frame 488
Blue band RVS & polarization sensitivity MS1 M13 fixed to pre-launch 412 443 488 Detector 4
Pre-launch M13 RVS M12 M13 RVS M12 M13
Blue band RVS & polarization sensitivity MS2 M13 fixed to pre-launch 412 443 488 Detector 4
MODIS-Terra vicarious characterization MS1, Detector 4 MS2, Detector 4 RVS M12 M13 RVS M12 M13 412 443 488 531 551 667 678
MODIS Terra and Aqua comparison Terra MS2, Detector 4 Aqua MS2, Detector 4 RVS M12 M13 RVS M12 M13 412 443 488 531 551 667 678
Comparison of MODIS-Terra and MODIS-Aqua Lwn Before Vicarious Characterization Lwn(412nm) band 8 Lwn(443nm) band 9 Lwn(488nm) band 10 Lwn(531nm) band 11 Lwn(551nm) band 12 After Vicarious Characterization
MODIS-Terra residual RVS in Lwn Before Vicarious Characterization 412 443 488 MS1 MS2 After Vicarious Characterization 412 443 488
MODIS-Terra temporal anomalies Before Vicarious Characterization Lwn(488nm) band 10 chlor_a After Vicarious Characterization Lwn(488nm) band 10 chlor_a
Summary • MODIS-Terra shows evidence of residual error in instrument response versus scan-angle and on-orbit changes in polarization sensitivity (polarization amplitude of more than 30%). • The OBPG developed a vicarious on-orbit characterization for visible band polarization and RVS changes over time, using SeaWiFS Lwn. • Results show significant improvement in agreement between MODIS-Terra and MODIS-Aqua Lwn over the combined mission lifetime. • Future work will focus on vicarious characterization of the NIR. Franz, B.A., E.J. Kwiatkowska, G. Meister, and C.R. McClain (2008). Moderate Resolution Imaging Spectroradiometer on Terra: limitations for ocean color applications. J. Appl. Rem. Sens., in press.