Download
1 / 14
140 likes | 220 Views
This project involves evaluating the performance of a Speech Detection implementation through experiments focusing on user perception, system impact, and independent variables. Hypotheses are formulated, experiments designed and analyzed, and results presented in detail. Guidelines for creating informative and visually effective graphs are provided, along with grading criteria. The report includes an introduction, background on the algorithm, experiment design, results and analysis, and conclusions.

E N D
Project 1bEvaluation of Speech Detection Due: February 14th, at the beginning of class
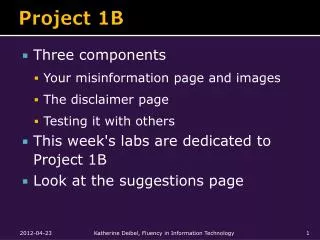
Overview • Experiments to evaluate performance of your Speech Detection implementation (Project 1) • Focus not only on how implementation performs, but also • formulation of hypotheses • design, implementation and analysis of experiments to test hypotheses • writeup • Can be done in groups of 2
Measures of Performance • User perception. Some possibilities are: • User opinion (rating) on quality • Understandability • Errors in listening ... • System impact. Some possibilities are: • CPU load • Size (in bytes) of sound recorded (without silence) • Processing time … • Decide on how each is to be measured • Example: Scale 1-10 for perception • Example: Time for CPU
Independent Variables • Must choose at least two. Possibilities: • Speaking tests: counting, vocabulary,… • Languages: Hindi, Chinese, Pig-Latin, ... • Background noise: quiet, noisy, Patriot's game, ... • Systems: OS version, CPU, sound card... • Hardware: cheap microphone, sound card • Audio quality parameters: rate, size, ... • ...
Algorithm Modifications • Must choose at least 1. • Possibilities include: • Thresholds. • Sound chunk size. • Endpoint detection length. • Computation of Energy (discrete or continuous) • Other modifications specific to your implementation. • ... • Formulate hypotheses • About how a change in independent variables affects your measures of performance
Results and Analysis • Details on results and analysis • Results are numeric measures • charts or tables • Analysis manipulates data • often graphs • understand relationships • interpreting results • Consider if data supports or rejectshypotheses
Report • Introduction • hypotheses and motivation for them • (not on silence detection, in general) • Background on your algorithm • Design of your experiments • details on setup, variables, measures of perf, … • Results and Analysis • Conclusions • summarize findings • Abstract • 1 paragraph that abstracts whole report • Write last, goes first
a b c Guidelines for Good Graphs (1 of 5) • “Art” not “rules”. Learn with experience. Recognize good/bad when see it. Many trials Require minimum effort from reader • Perhaps most important metric! • Given two, can pick one that takes less reader effort a b Ex: c Legend Box Direct Labeling
Guidelines for Good Graphs (2 of 5) Maximize information • Include title • Make self-sufficient • Key words in place of symbols • Ex: “PIII, 850 MHz” and not “System A” • Ex: “Daily CPU Usage” not “CPU Usage” • Axis labels as informative as possible • Ex: “Response Time (seconds)” not “Response Time” • Can help by using captions, too • Ex: “Transaction response time in seconds versus offered load in transactions per second.”
1 .1 Availability Unavailability Guidelines for Good Graphs (3 of 5) Minimize ink • Maximize information-to-ink ratio • Too much unnecessary ink makes chart cluttered, hard to read • Ex: no gridlines unless needed to help read • Chart that gives easier-to-read for same data is preferred • Same data • Unavail = 1 – avail • Right probably better
Guidelines for Good Graphs (4 of 5) Use commonly accepted practices • Present what people expect • Ex: origin at (0,0) • Ex: independent (cause) on x-axis, dependent (effect) on y-axis • Ex: x-axis scale is linear • Ex: increase left to right, bottom to top • Ex: scale divisions equal • Departures are permitted, but require extra effort from reader so use sparingly
Guidelines for Good Graphs (5 of 5) Avoid ambiguity • Show coordinate axes • Show origin • Identify individual curves and bars • Do not plot multiple variables on same chart
Hand In • Hardcopy! • Due at beginning of class • Email turn in: • Any testing Code/Scripts used/modified • Makefile/Project file
Grading Experiments Report 5% Abstract 5% Introduction Background (as needed) 10% Experiment design 15% Results and analysis 5% Conclusions 10% (Other) • 10% Measure of user perception • 10% Measure of system impact • 10% Independent variable 1 • 10% Independent variable 2 • 10% Algorithm modification (Grading Rubric on Web Page)