Download
1 / 14
140 likes | 270 Views
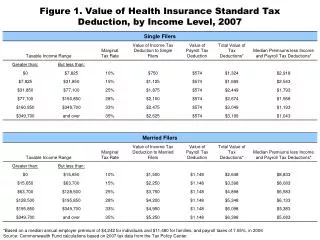
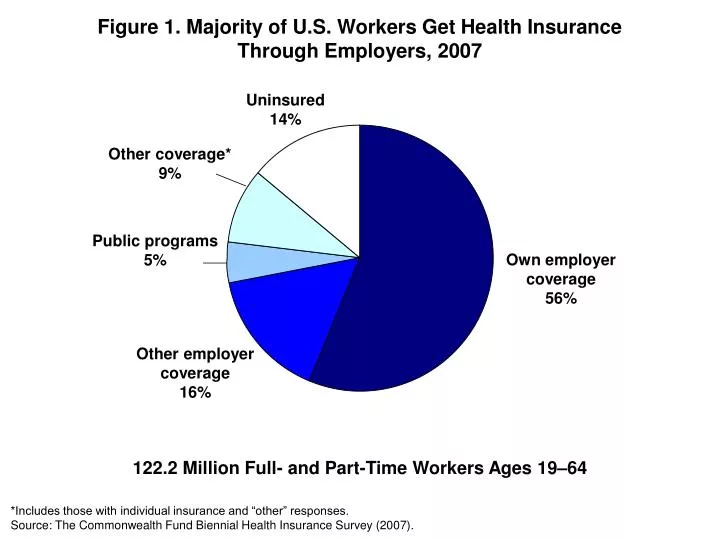
Figure 1. Majority of U.S. Workers Get Health Insurance Through Employers , 2007. Uninsured 14%. Other coverage* 9%. Public programs 5%. Own employer coverage 56%. Other employer coverage 16%. 122.2 Million Full- and Part-Time Workers Ages 19–64.

E N D
Figure 1. Majority of U.S. Workers Get Health Insurance Through Employers, 2007 Uninsured 14% Other coverage* 9% Public programs 5% Own employer coverage 56% Other employer coverage 16% 122.2 Million Full- and Part-Time Workers Ages 19–64 *Includes those with individual insurance and “other” responses. Source: The Commonwealth Fund Biennial Health Insurance Survey (2007).
Figure 2. Employer-Sponsored Insurance Coverage Declined Among Small-Firm Employees, 2003–2007 Percent of working adults^ ages 19–64 85 84 57 49 Small Firms (fewer than 50 employees) Large Firms (50 or more employees) ^Includes both part-time and full-time workers. Note: Subgroups may not sum to totals because of rounding. Source: The Commonwealth Fund Biennial Health Insurance Surveys (2003 and 2007).
Figure 3. Low-Wage Employees in Small Firms Are Less Likely to Have Employer-Sponsored Insurance Coverage Percent of working adults^ ages 19–64 94 85 68 62 49 38 Small Firms (fewer than 50 employees) Large Firms (50 or more employees) ^Includes both part-time and full-time workers. Note: Subgroups may not sum to totals because of rounding. Source: The Commonwealth Fund Biennial Health Insurance Survey (2007).
Figure 4. Over Half of Working Adults in Small Firms Were Uninsured or Underinsured During the Year, 2007 Adequately insured 48% Uninsured anytime 15% Uninsured anytime 36% Underinsured 13% Adequately insured 73% Underinsured 16% Large Firms (50 or more employees) 76.9 million Small Firms (fewer than 50 employees) 39.0 million ^Includes both part-time and full-time workers. Underinsured is defined as having continuous health insurance coverage and spending 10 percent or more of income on out-of-pocket health care costs (or 5 percent or more if low income), or having deductibles of 5 percent or more of income. Source: The Commonwealth Fund Biennial Health Insurance Survey (2007).
Figure 5. More Than Half of Uninsured Workers Are Ineligible for Their Firm’s Plan or Employed by Firms That Do Not Offer Health Benefits Worker does not know if offered or eligible 28% Employer does not offer coverage 37% Employer offers, worker eligible, does not participate 20% Employer offers, worker ineligible 16% 17.3 Million Uninsured Workers Ages 19–64 Source: The Commonwealth Fund Biennial Health Insurance Survey (2007).
Figure 6. Workers in Small Firms Are Less Likely to Be Offered and Eligible for Health Insurance from Their Employer Percent of working adults^ ages 19–64 Small Firms (fewer than 50 employees) Large Firms (50 or more employees) ^Includes both part-time and full-time workers. Source: The Commonwealth Fund Biennial Health Insurance Survey (2007).
Figure 7. Share of Small Firms Offering Benefits to Employees and Employee Eligibility Declined, 2003–2007 Percent of working adults^ ages 19–64 Small Firms (fewer than 50 employees) Large Firms (50 or more employees) ^Includes both part-time and full-time workers. Source: The Commonwealth Fund Biennial Health Insurance Surveys (2003 and 2007).
Figure 8. When Employees in Small Firms Are Offered and Eligible for Employer-Sponsored Coverage, Take-Up Rate Is High Percent of working adults^ ages 19–64 who are eligible for and take up employer-sponsored insurance ^Includes both part-time and full-time workers. Source: The Commonwealth Fund Biennial Health Insurance Survey (2007).
Figure 9. Low-Wage Workers in Small Firms Are Less Likely to Have Health Insurance Than High-Wage Workers in Small Firms Insurance sources for working adults^ ages 19–64 98 94 92 88 86 72 59 Small Firms(fewer than 50 employees) Large Firms(50 or more employees) ^Includes both part-time and full-time workers. Source: The Commonwealth Fund Biennial Health Insurance Survey (2007).
Figure 10. The Individual Insurance Market Is Not an Affordable Option for Small-Firm Workers^ ^Includes both part-time and full-time workers. *Among those who tried to buy a plan. Source: The Commonwealth Fund Biennial Health Insurance Survey (2007).
Figure 11. Share of Workers Spending Large Shares of Income on Out-of-Pocket Medical Expenses Increased, 2003–2007 Percent of working adults^ ages 19–64 with own employer-sponsored insurance Total Small Firms (fewer than 50 employees) Large Firms (50 or more employees) ^Includes both part-time and full-time workers. Source: The Commonwealth Fund Biennial Health Insurance Surveys (2003 and 2007).
Figure 12. Workers with Lower Wages, Regardless of Employer Size, Are More Likely to Spend Large Share of Income on Out-of-Pocket Medical Costs and Premiums Percent of working adults^ ages 19–64 with own employer-sponsored insurance Large Firms (50 or more employees) ^Includes both part-time and full-time workers. Source: The Commonwealth Fund Biennial Health Insurance Survey (2007).
Figure 13. Insurance Benefits Are Not as Generous for Workers in Small Businesses Percent of working adults^ ages 19–64 with own employer-sponsored insurance Coverage limits total amount it will pay for medical care No prescription drug coverage Fair or poor rating of insurance plan ^Includes both part-time and full-time workers. Source: The Commonwealth Fund Biennial Health Insurance Survey (2007).
Figure 14. Cost of Administering Health Insurance as a Percentage of Claims Under Current Law and the Proposed Exchange, by Group Size Percent Data: Estimates by The Lewin Group for The Commonwealth Fund. Source: Commonwealth Fund Commission on a High Performance Health System, The Path to a High Performance U.S. Health System: A 2020 Vision and the Policies to Pave the Way (New York: The Commonwealth Fund, Feb. 2009).