Download
1 / 72
720 likes | 882 Views
Aggregated Convection, Tropical Cyclones, and Climate Kerry Emanuel Program in Atmospheres, Oceans and Climate Massachusetts Institute of Technology. There are more things in heaven and earth, Horatio, than are dreamt of in your philosophy. -- Climate physicist, to Horatio a climate modeler.

E N D
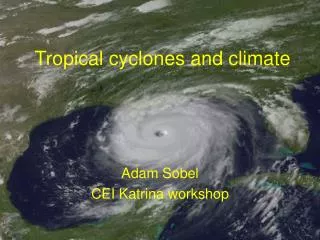
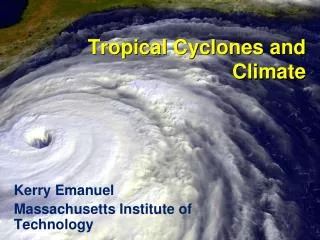
Aggregated Convection, Tropical Cyclones, and Climate Kerry EmanuelProgram in Atmospheres, Oceans and ClimateMassachusetts Institute of Technology
There are more things in heaven and earth, Horatio, than are dreamt of in your philosophy. -- Climate physicist, to Horatio a climate modeler
We are such stuff as dreams are made on, and our little life is rounded by a sleep
Model Disagreement = Uncertainty: Is this true?
Climate modeler Climate understanding desert Skeptic
Specific Issues Addressed Here • Aggregated convection as an example of self-organized criticality (SOC) • Implications for climate • Implications for incidence of tropical cyclones • Tropical cyclone effects on the meridional overturning circulation
Frequency histogram of rawindsonde relative humidities from 1600 ascents at the tropical Pacific islands of Yap, Koror, Ponape and Majuro, January-May, 1994-95. Spencer and Braswell, Bull. Amer. Meteor. Soc., 1997.
What controls the distribution of water vapor and precipitation?A critical problem in climate!
A Partial List of Factors: • Convective lofting of water • Cloud and rain microphysics • Subsidence • Large-scale advection
Here we will consider the idealized problem of what determines the distribution of humidity in radiative-convective equilibrium states. • Generally derided as irrelevant to the real world (yet not a bad approximation to warm pool regions) • Need to understand “simple” problems first • There are some surprises even in this “simple” problem
Numerical Simulations of RC Equilibrium Vertically integrated water vapor at 4 days (Nolan et al., QJRMS, 2007)
Sensitivity of relative humidity to cloud microphysics in radiative-convective equilibrium (25 mb grid spacing, fixed SST)
Climate Sensitivity of Relative Humidity in Radiative-Convective Equilibrium
Understanding Free Tropospheric Humidity Influences on Convection through Quasi-Equilibrium (QE) Concepts Boundary Layer QE (Raymond, 1995): Moist static energy PBL moist static energy
large-scale Smaller hm gives smaller Mu Only yields cloud base mass flux! Note: Under global warming, increases slowly, while increases rapidly
Temperature tendency of free atmosphere: Need closure for Md:
Summary of BLQEFree troposphere moisture affects convection by: • Changing cloud base mass flux: Fewer downdrafts needed to balance surface fluxes and convergence when free troposphere is dry • Affecting fraction of condensed water that reaches surface: Precipitation efficiency is a function of humidity. Low humidity can reduce precipitation through entrainment and/or increased evaporation of precipitation
All of the preceding assumes that moist convection is statistically homogeneous if lower boundary condition is constant.Is this true?
Numerical simulations of RC equilibrium show that, under some conditions, moist convection self-aggregates Day 10 Day 50 From Bretherton et al. (2005)
Vertically integrated water vapor at 4 (a), 6 (b), 8 (c), and 10 (d) days (Nolan et al., QJRMS, 2007)
Effect of Self-Aggregation on Humidity (Bretherton et al. , 2005)
Empirical Necessary Conditions for Self-Aggregation (after Held et al., 1993; Bretherton et al., 2005; Nolan et al.; 2007) • Small vertical shear of horizontal wind • Interaction of radiation with clouds and/or water vapor • Feedback of convective downdraft surface winds on surface fluxes • Sufficiently high surface temperature
Hypothesis • At high temperature, convection self-aggregates • →Horizontally averaged humidity drops dramatically • →Reduced greenhouse effect cools system • →Convection disaggregates • →Humidity increases, system warms • →System wants to be near phase transition to aggregated state
Recipe for Self-Organized Criticality(First proposed by David Neelin, but by different mechanism) • System should reside near critical threshold for self-aggregation • Convective cluster size should follow power law distribution
Properties • PBL quasi-equilibrium enforced • Bulk aerodynamic surface fluxes with convective gustiness • Albedo and emissivity simple weighted average of clear and cloudy regions • Water vapor-dependent clear sky emissivity • Horizontally uniform temperature but variable moist static energy (i.e. water vapor) at mid-level • Vertical motion calculated to enforce zero horizontal temperature gradient • PBL moist static energy adjusted to yield zero domain-averaged vertical motion • Slow horizontal diffusion of moisture at mid-level
ResultsSelf-Aggregation Occurs for: • Small or negative gross moist stability • Sufficiently large feedback between convective gustiness and surface enthalpy fluxes • Sufficiently high surface temperature
Summary of Toy Model Results • Self-aggregation driven by convective gustiness at high temperature • No self-aggregation at low temperature • Aggregated state is much drier at mid levels • System tends towards self-organized criticality (SOC) • Climate sensitivity of SOC state much lower (0.04 K/Wm-2) than sensitivity of uniform convection (0.2 K/Wm-2)
Tracks of all tropical cyclones, 1985-2005 Source: Wikipedia
Global TC Frequency, 1970-2006 Data Sources: NOAA/TPC and NAVY/JTWC
Better Intensity Metric:The Power Dissipation Index A measure of the total frictional dissipation of kinetic energy in the hurricane boundary layer over the lifetime of the storm
Atlantic Storm Maximum Power Dissipation (Smoothed with a 1-3-4-3-1 filter) Years included: 1870-2006 Power Dissipation Index (PDI) Data Source: NOAA/TPC
Atlantic Sea Surface Temperatures and Storm Max Power Dissipation (Smoothed with a 1-3-4-3-1 filter) Years included: 1870-2006 Power Dissipation Index (PDI) Scaled Temperature Data Sources: NOAA/TPC, UKMO/HADSST1
Feedback of Global Tropical Cyclone Activity on the Climate System
Direct mixing by tropical cyclones Emanuel (2001) estimated global rate of heat input as 1.4 X 10¹⁵ Watts Source: Rob Korty, CalTech
TC Mixing May Induce Much or Most of the Observed Poleward Heat Flux by the Oceans Trenberth and Caron, 2001
TC-Mixing may be Crucial for High-Latitude Warmth and Low-Latitude Moderation During Warm Climates, such as that of the Eocene
Our Approach Step 1: Seed each ocean basin with a very large number of weak, randomly located cyclones Step 2: Cyclones are assumed to move with the large scale atmospheric flow in which they are embedded Step 3: Run a coupled, ocean-atmosphere computer model for each cyclone, and note how many achieve at least tropical storm strength Step 4: Using the small fraction of surviving events, determine storm statistics.
Track: Empirically determined constants:
Present Climate: Spatial Distribution of Genesis Points Observed Synthetic
Calibration Absolute genesis frequency calibrated to North Atlantic during the period 1980-2005