Download
1 / 18
230 likes | 320 Views
This article delves into the rich history and fascinating numbers of the video game industry. From the exponential growth in household participation to the financial comparisons with other industries, such as recorded music and movies, you will explore the dynamics of this thriving market. Learn about the significant players, digital game platforms, development processes, publishing strategies, and retail landscape. Uncover the impact of intellectual property, piracy challenges, and market trends shaping the industry. Dive into the partnership synergies, retail antagonisms, and financial breakdowns that drive this captivating sector forward.

E N D
Some Numbers... • 65% of US households play • 80K employees directly, 250K in US • 9 games per second • Average player age is 35, 40% female, 60% male • 778 titles released in 2009 • 2009=$19.6B in US ($10.5B H, $9.1B S) • $18.5B in 2010; $76B by 2013
Compared to other Industries • Recorded music= $17B global • Movie ticket sales= $29.9 B global • Book sales= $35.9 B in US • Newspapers ad revenues= $37.85B in US • Magazine ad revenues= $19.45B in US • Cable Revenue= $89.9B in US • Global video game market= $46.5B-$55B
Digital Games • Console • Handheld • Computer • Arcade
The Big 3 • Xbox: • 24.3%, $58B (17% of Microsoft) • Nintendo: • 1889, 47.4%, $18.9B • Playstation: • 28.8%, $10.7B/$79 B
The Big Three Are??? • Horizontally Integrated??? • Vertically Integrated??? • Diversified??? • Synergism??? • Market IS???
Hardware • Online Play • More than just a game player • Accessories/Peripheral market • “Loss Leaders”...not Nintendo! • Play exclusive/3rd party games • Planned obselesence, 5-10yrs • New hardware sales=Software demands • Royalty Structure....
Development • $10M for one platform, $18-28 for multiple • Get advance, 2-3 years, 20% avg. of sales profits • First Party: internal teams • Second Party: publisher's concept/license/contract • Third Party: develop and sell. Hired by publishers on contract basis. Advance/Royalty system. • Publisher's and creative control/Franchising • Consolidation to compete w/ Big 3 or Big 5 • Gamers As developers
Publishing • Marketing/Promotion/Sales • Main Investors in game/Retain IP • Franchising/Branding... “Hit Driven” • Product Placement or IGA...$1B, Demo??? • Licensing content • Publishing license to console manufacturer ($5-8 per game manufactured) • Distro= store, ship, and sales
Publishing • Nintendo • Activision Blizzard/ Vivendi Games $5B • EA $4.2B • Ubisoft $1.4B • Take-Two Interactive $968M • Sony #6, Microsoft #10, MTV Games #14, WB #16, Disney #17, LucasArts #20
Synergism • Cross-industry licensing • Super Mario • Tomb Raider • Harry Potter/LOR • Star Wars/Indiana Jones Legos • Reproduction? • DJ Hero
Retail • “Real Estate” • Antagonism with Publishers/Distro • Gamestop 21% of market, Wal-Mart, Best Buy, EB Games, Game Crazy • $2.5B used market, most profit$ • Holiday season=50% of sales • MDF (Marketing Development Funds)
$60 Game Cost Breakdown • $15 to retail • $7 to returns, “price protection” and MDF • $4 to distro as shipping and COG • $7 to platform royalty fee • $27 to publisher, 10-70% paid to 3rd party developer against advance • Every game sold $12 is lost to piracy or used games (Pub/Devel hate used games!!!) • In-house/Vertical integration???
Intellectual Property • Piracy: $3.5B on hard goods • 2007, $945M Nintendo • Royalty System • Open Source Games/ Self Publishing • Mergers and “Acquisitions” • Licensing • Essentially videogames are ALL IP!
Market • -8% in 2009 in 3 largest markets • “Family Entertainment” genre #1 • Console= 60% • PC= 16% • Mobile= 4% • Portable= 11% • Online Subscription= 8%
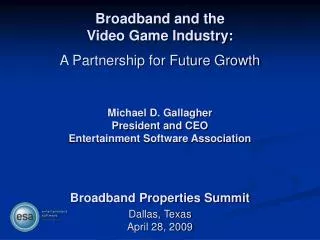
“The ESA offers a range of services to interactive entertainment software publishers including a global anti-piracy program, business and consumer research, government relations and intellectual property protection efforts. The ESA also owns and operates the E3 Expo.”