Download
1 / 24
290 likes | 717 Views
2.4GHz Single Balanced Mixer. Andrew Bacon Jacqueline Griffin John Stone. Mixer Specifications. IF Frequency: 140 MHz RF Frequency: 2400-2485 MHz RF Power: -10 dBm LO Frequency: 2260-2345 MHz LO Power: 8 dBm Conversion Loss: > -9.5 dB LO-RF Rejection: < -20 dB

E N D
2.4GHz Single Balanced Mixer Andrew Bacon Jacqueline Griffin John Stone
Mixer Specifications • IF Frequency: 140 MHz • RF Frequency: 2400-2485 MHz • RF Power: -10 dBm • LO Frequency: 2260-2345 MHz • LO Power: 8 dBm • Conversion Loss: > -9.5 dB • LO-RF Rejection: < -20 dB • LO-IF Rejection: <-30 dB
Balun Design and Simulation • Used an r of 2.9 for second layer to compensate for it being buried.
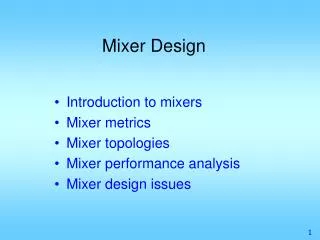
Matching Design and Simulation • Find input impedance of diodes at 2.4 GHz • Design single stub network between diodes and balun • Let simulator optimize LC filter at output
Mixer Layout 2.6 in LO Port Diode Matching Circuits Diode 1.7 in LO Return Coupler IF Block LC LPF Ghetto Lettering IF Port RF Port
Resulting Board (Problems) • All holes that were supposed to be connected to ground were not • All holes that were not supposed to be connected to ground were • Missing parts of Traces
Mixer Board Top View Bottom View
Measurement Methodology Down Converter • Used spectrum analyzer because it has low error (~.1dB) • Low frequency cable was taken out of measurement through calibration • High frequency cable was taken out of measurement by measuring the response of the cable after measuring the mixer • Used spectrum analyser to measure IF rejection
2.260 000 00 GHz IF RF LO Measurement Diagram (Down Converter) Vector Network Analyzer RF LO LO Signal Generator
Downconverter Measurements RF Freq = 2.40 GHz RF Freq = 2.44 GHz RF Freq = 2.485 GHz
Frequency Shift Measurements Desired Frequency Response Conversion Loss RF freq Results Adjusting the IF return led to being able to shift the frequency Band up to 2.0 GHz on another board If inductor were used this adjustment would be much easier As stub is shorted to ground at end.
Simulation Verification Conversion Loss RF freq (GHz)
Measurement Methodology Up Converter • Used spectrum analyzer
2.260 000 00 GHz 1 400000 00 MHz IF RF LO Measurement Diagram (Up Converter) IF Signal Generator LO Signal Generator
Upconverter Measurements LO Freq = 2.26 GHz LO Freq = 2.30 GHz LO Freq = 2.345 GHz
Upconverter Sweep Measurement • LO Frequency Swept from 2.26 GHz to 2.345 GHz
Simulations vs. Measurements Possible Reasons for inaccuracies • Fabrication (~.5dB) • Inaccurate r • Multilayer simulation problems with ADS
Improvements • Use inductor for IF return (will allow more tuning) • Verify technology parameters • Verify ADS’s simulation abilities