Download
1 / 21
280 likes | 704 Views
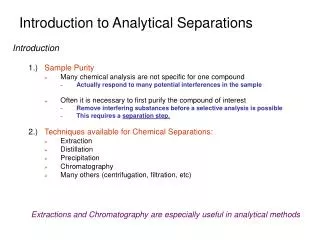
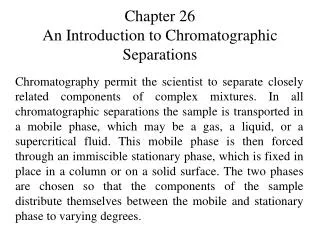
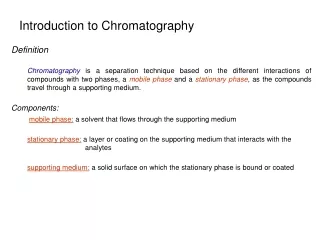
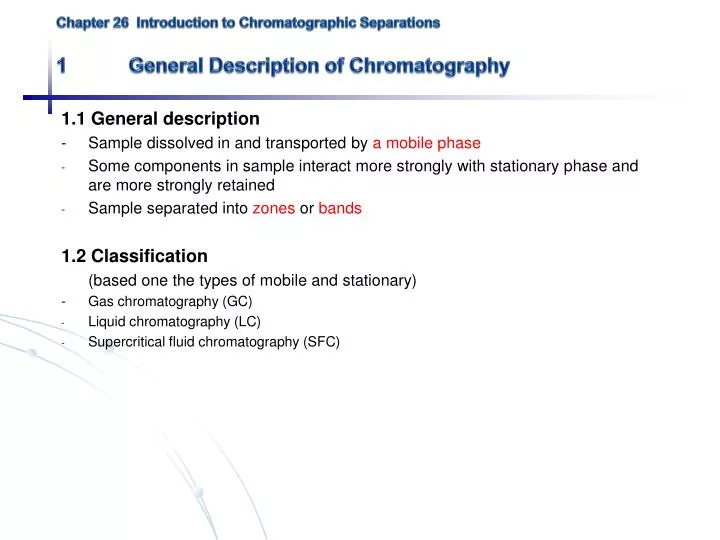
Chapter 26 Introduction to Chromatographic Separations 1 General Description of Chromatography. 1.1 General description - Sample dissolved in and transported by a mobile phase Some components in sample interact more strongly with stationary phase and are more strongly retained

E N D
Chapter 26 Introduction to Chromatographic Separations1 General Description of Chromatography 1.1 General description - Sample dissolved in and transported by a mobile phase • Some components in sample interact more strongly with stationary phase and are more strongly retained • Sample separated into zones or bands 1.2 Classification (based one the types of mobile and stationary) - Gas chromatography (GC) • Liquid chromatography (LC) • Supercritical fluid chromatography (SFC)
Classification based on the types of mobile and stationary phases
1.3 Elution chromatography: Flushing of sample through column by continual mobile phase addition - only eluent (portion of sample in mobile phase) moves down - migration rate fraction of time spent in mobile phase Fig. 26-1 (p.764) (a) The separation of a mixture of components A and B by column elution chromatography, (b) the output of the signal detector
Chromatogram (concentration versus elution time) • More strongly retained species elutes last (elution order) • Analyte is diluted during elution (dispersion) • - Zone broadening proportional to elution time Fig. 26-2 (p.765) Concentration profiles of solute bands A and B at two different times in their migration down the column.
Adjust migration rates for A and B (increase band separation) • Adjust zone broadening (decrease band spread) Fig. 26-3 (p.765) Two-component chromatogram illustrating two methods for improving overlapping peaks.
2 Migration Rates of Solutes 2.1 Distribution constant Analyte A in equilibrium with two phases
2.2 Retention time Fig. 26-4 (p.767) A typical chromatography for a two component mixture. tM time for unretained species (dead time), same rate as mobile phase molecules average migration rate tR retention time for retained species average migration rate Ideally: tR independent of volume injected, produces a Gaussian peak
2.4 retention factor k kA is 1.0, separation is poor kA is >20-30, separation is slow kA is between 1-10, separation is optimum
2.5 Relative migration rate: Selectivity factor () Selectivity factor Larger = better separation
3 Band Broadening & Column Efficiency 3.1 Rate theory of chromatography - Individual molecule undergoes “random walk”, and many thousands of adsorption/desorption processes. - Some travel rapidly while other lag add up to give Gaussian peak (like random errors) - Breadth of band increases down column because of more time - Zone broadening is affecting separation efficiency – high efficiency requires less broadening
3.2 Column efficiency N: number of plates L: length of column H: height of 1 theoretical plate Plates are only theoretical – column efficiency increase with N Efficient column has small plate height – less zone broadening Fig. 26-6 (p.770) Definition of H.
Experimentally, H and N can be approximated from the width of the base of chromatographic peak. Fig. 26-7 (p.770) Determination of N.
3.3 Kinetic variables affecting column efficiency (H) 3.3.1 Mobile phase velocity - Higher mobile phase velocity, less time on column, less zone broadening - However, plate height H also changes with flow rate Fig. 26-7 (p.770) Effect of mobile-phase flow on plate height for GC.
3.3.2 van Deemter Equation A: multipath term • Molecules move through different paths • Larger difference in path length for larger particles • At low flow rates, diffusion allows particles to switch between paths quickly and reduces variation in transit time Fig. 26-9 (p.773) Typical pathways of two molecules during elution.
B/: Longitudinal diffusion term • Diffusion from central zone to front and tail • Proportional to analyte diffusion coefficient • Inversely proportional to flow rate • high flow, less time for diffusion C: Mass transfer coefficients (CS and CM) • CS is rate for adsorption onto stationary phase • CM is rate for analyte to desorb from stationary phase • Effect proportional to flow rate – at high flow rates less time to approach equilibrium Fig. 26-10 (p.774) van Deemter plot.
4 Optimization of Column Performance Column resolution • - u (linear flow rate): low flow rate favors increased resolution (van Deemter plot) • H (plate height) (or N number of plates): use smaller particles, lengthen column, reduce viscosity of mobile phase (diffusion) • - (selectivity factor): vary temperature, composition of column/mobile phase • - kA (retention factor): vary temperature, composition of column/mobile phase Fig. 26-12 (p.776) Separation at three resolution values
Effect of k and a on R When A and B have similar retention
General elution problem: for multiple components, conditions rarely optimum for all components. Fig. 26-15 (p.780) The general elution problem in chromatography Change liquid mobile phase composition – gradient elution or solvent programming Change temperature for gas chromatography – temperature programming
5 Summary Section 26E concepts and formulas in Table 26-4 and 26-5 (p781, Reading assignment)