Download
1 / 11
120 likes | 218 Views
Forecasting Exact Snowfall Amounts. Precipitation Type.

E N D
Precipitation Type First, the forecaster must determine what type of precipitation is expected. Use Table I as a guide to determine whether you will have liquid or frozen precipitation. In addition, you can also use the Freezing Drizzle vs. Snow Checklist (Table II) developed by Headquarters Air Weather Service, Technology Training Division at Scott AFB, IL (1996). It will help you determine whether to forecast freezing or frozenprecipitation.
Predicting Moderate and Heavy Snow If you think the weather situation has the possibility of moderate or heavy snow, continue with Table V. This table has specific parameters and features to look for at mandatory levels from the surface all the way up to 200 mb. This information was gathered from a multitude of sources, the bulk of which came from McNulty (1991), Terry (1995), and Weber (1979). Other sources came from academicians such as Djuric (1994), Moore (1989), and Ucccellini (1990). With winter weather lasting 3 or 4 months in most locations, forecasters tend to forget what to look for at various levels. The following information will ease that memory loss, and allow operational forecasters quick and easy reference, to better forecast major snowstorms.
Table V HINTS FOR FORECASTING MODERATE TO HEAVY SNOW (S+) • 1. Surface • Around 2 to 2.5 degrees latitude to the left of the track of the low (150-240 nm) • Approximately 5 degrees latitude ahead of the low • As long as low isdeepening, heavy snow will still occur • When low fills, the heavy snow usually ends. • When the cold surface anticyclone is to the N or NW--typically enhanced by confluent mid level flow • Optimum surface temperature 27 to 32F
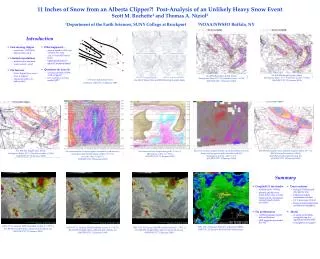
Table V HINTS FOR FORECASTING MODERATE TO HEAVY SNOW (S+) • 2. 850 mb • About 1.5 degrees latitude to the left of the track of the low (60 to 240 nm) • When cooling occurs in the rear quadrant of the low during early stages of development, heavy snow occurs • Heavy snows occur more frequently with lows that generally move NE • Heavy snows less rare with lows dropping south of east (e.g. Alberta Clipper or Manitoba Mauler, Saskatchewan Screamer) • -5 C isotherm bisects the heavy snow • -2C to -8 C for moderate snow • >5 C of WAA moving into area of interest (overrunning)
Table V HINTS FOR FORECASTING MODERATE TO HEAVY SNOW (S+) • 3. 700 mb • S+ band between -6C and -8 C (-7 C best) temperature, and south of -10 C dew point line. • S+ band along path and just left of low • Snow begins at 700 mb ridge line and ends at trough line • S+ band with greatest moisture at H7 • North of the 700 mb closed contour
Table V HINTS FOR FORECASTING MODERATE TO HEAVY SNOW (S+) • 4. 500 mb • About 7 degrees latitude downstream of the vorticity max • Slightly left of the track of the closed low/strong vorticity max (approx 2 degrees) • Slightly downstream from where the curvature changes from cyclonic to anticyclonic • When low or trough deepens (look for significant height falls GTE 90m) • When the average lowest 500 mb temperature within distance of 3 degrees latitude of the vorticity max is -30 C • S+ band between -20 C and -25 C (-23 C best) • If storm warms at 500 mb, S+ left of 500 mb low. Otherwise, S+ left of surface low track. • S+ begins at 500 mb ridge line. Ends at either the trough or the inflection point between trough and ridge. • Vicinity of vorticity max path: varies from 60 miles left of vorticity max in open trough or shear zone, to 150 miles left of vorticity max in circulation center or closed low • If surface low is to right of 500 mb height fall center track, S+ will lie parallel and left of height fall track • If surface low is to left of 500 mb height fall center track, S+ parallel and left of either the surface low or 500 mb low track
Table V HINTS FOR FORECASTING MODERATE TO HEAVY SNOW (S+) • 5. 300 mb • S+ along left front exit region and right rear entrance region of jet max • S+ in area between coupled jet • Look for strongest Q-Vector convergence • Typical S+ occurs with deep or deepening long wave
Table V HINTS FOR FORECASTING MODERATE TO HEAVY SNOW (S+) • 6. 200 mb • Look for stratospheric warming on 200 mb chart, as well as on cross section and time section • Heavy snow occurs just to the north of 164 height line