Chapter 7 ~ Sample Variability
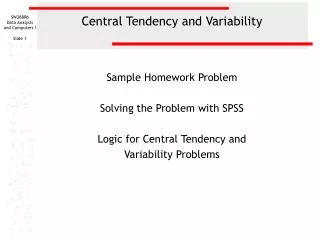
Chapter 7 ~ Sample Variability. Empirical Distribution of Sample Means. 9. 8. 7. Frequency. 6. 5. 4. 3. 2. 1. 6.8. 7.2. 7.6. 8.0. 8.4. 8.8. 9.2. 9.6. 10.0. 10.4. 10.8. 11.2. 0. Sample Mean. Chapter Goals.

Chapter 7 ~ Sample Variability
E N D
Presentation Transcript
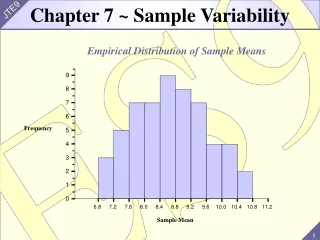
Chapter 7 ~ Sample Variability Empirical Distribution of Sample Means 9 8 7 Frequency 6 5 4 3 2 1 6.8 7.2 7.6 8.0 8.4 8.8 9.2 9.6 10.0 10.4 10.8 11.2 0 Sample Mean
Chapter Goals • Investigate the variability in sample statistics from sample to sample • Find measures of central tendency for sample statistics • Find measures of dispersion for sample statistics. • Find the pattern of variability for sample statistics
7.1 ~ Sampling Distributions • To make inferences about a population, we need to understand sampling • The sample mean varies from sample to sample • The sample mean has a distribution; we need to understand how the sample mean varies and the pattern (if any) in the distribution
Sampling Distribution of a Sample Statistic • Sampling Distribution of a Sample Statistic: The distribution of values for a sample statistic obtained from repeated samples, all of the same size and all drawn from the same population • Example: Consider the set {1, 2, 3, 4}: 1) Make a list of all samples of size 2 that can be drawn from this set (Sample with replacement) 2) Construct the sampling distribution for the sample mean for samples of size 2 3) Construct the sampling distribution for the minimum for samples of size 2
Table of All Possible Samples This table lists all possible samples of size 2, the mean for each sample, the minimum for each sample, and the probability of each sample occurring (all equally likely)
Sampling Distribution Sampling Distributionof the Sample Mean Histogram: Sampling Distributionof the Sample Mean • Summarize the information in the previous table to obtain the sampling distribution of the sample mean and the sample minimum:
Sampling Distribution Sampling Distribution of the Sample Minimum: Histogram: Sampling Distribution of the Sample Minimum:
Example 1 The Population: Theoretical Probability Distribution 0.18 m = 3 . 5 0.16 0.14 s = 1 . 7078 0.12 0.10 0.08 0.06 0.04 0.02 0.00 1 2 3 4 5 6 • Example: Consider the population consisting of six equally likely integers: 1, 2, 3, 4, 5, and 6. Empirically investigate the sampling distribution of the sample mean. Select 50 samples of size 5, find the mean for each sample, and construct the empirical distribution of the sample mean.
Empirical Distribution of the Sample Mean = x x 3 . 352 = s 0 . 714 14 x 12 10 Frequency 8 6 4 2 0 x 1.8 2.3 2.8 3.3 3.8 4.3 4.8 5.3 Sample Mean • Samples of Size 5
Important Notes & Random Sample 1. : the mean of the sample means 2. : the standard deviation of the sample means 3. The theory involved with sampling distributions described in the remainder of this chapter requires random sampling x s x Random Sample: A sample obtained in such a way that each possible sample of a fixed size n has an equal probability of being selected • (Every possible handful of size n has the same probability of being selected)
7.2 ~ Where Does This Lead Us? • Describing the most important idea in all of statistics • Describes the sampling distribution of the sample mean • Examples suggest: the sample mean (and sample total) tend to be normally distributed
Important Definition & Theorem m 1. have a mean equal to m 2. have a standard deviation equal to Further, if the sampled population has a normal distribution, then the sampling distribution of will also be normal for samples of all sizes x s s n x x Sampling Distribution of Sample Means If all possible random samples, each of size n, are taken from any population with a mean m and a standard deviation s, the sampling distribution of sample means will: Central Limit Theorem The sampling distribution of sample means will become normal as the sample size increases.
Summary • The mean of the sampling distribution of is equal to the mean of the original population: x m = m x • The standard deviation of the sampling distribution of (also called the standard error of the mean) is equal to the standard deviation of the original population divided by the square root of the sample size: Notes: • The distribution of becomes more compact as n increases. (Why?) • The variance of : x s = s n x x 2 2 s = s n x x • The distribution of is (exactly) normal when the original population is normal x • The CLT says: the distribution of is approximately normal regardless of the shape of the original distribution, when the sample size is large enough! x
Standard Error of the Mean Standard Error of the Mean: The standard deviation of the sampling distribution of sample means: s = s n x Notes: • The n in the formula for the standard error of the mean is the size of the sample • The proof of the Central Limit Theorem is beyond the scope of this course • The following example illustrates the results of the Central Limit Theorem
Graphical Illustration of the Central Limit Theorem Distribution of x:n = 2 Original Population 30 30 Distribution of x:n = 30 Distribution of x:n = 10
7.3 ~ Applications of the Central Limit Theorem • When the sampling distribution of the sample mean is (exactly) normally distributed, or approximately normally distributed (by the CLT), we can answer probability questions using the standard normal distribution, using the TI 83/84 functions for dealing with the normal distribution, like normcdf and invNorm.
Example 2 1) 2) £ £ P ( 45 x 60 ) £ P ( x 47 . 5 ) Solutions: Since the original population is normal, the distribution of the sample mean is also (exactly) normal • 1) m = m = 50 x • 2) s = s = = = n 15 9 15 3 5 x • Example: Consider a normal population with m = 50 ands = 15. Suppose a sample of size 9 is selected at random. Find:
Example 2 x 45 50 60 - 2.00 1.00 0 - - æ ö 45 50 60 50 x - £ £ = £ £ z = ; z P ( 45 x 60 ) P ç ÷ è ø 5 5 s n = - £ £ P ( 1.00 z 2.00) = + = 0 . 3413 0 . 4772 0 . 8185
Example 2 x 47.5 50 0 -0.50 - - æ ö x 50 47 . 5 50 x - £ = £ z = ; P ( x 47 . 5 ) P ç ÷ è ø 5 5 s n = £ - P ( z . 5 ) = - = 0 . 5000 0 . 1915 0 . 3085
Example 3 Solutions: • The shape of the original distribution is unknown, but the sample size, n, is large. The CLT applies. • The distribution of is approximately normal x m = m = s = s = » 109 n 20 50 2 . 83 x x • Example: A recent report stated that the day-care cost per week in Boston is $109. Suppose this figure is taken as the mean cost per week and that the standard deviation is known to be $20. 1) Find the probability that a sample of 50 day-care centers would show a mean cost of $105 or less per week. 2) Suppose the actual sample mean cost for the sample of 50 day-care centers is $120. Is there any evidence to refute the claim of $109 presented in the report?
Example 3 x - æ ö 105 109 x - z £ = £ z = ; P ( x 105 ) P ç ÷ è ø 2 . 83 s n = £ - P ( z 1 . 41 ) = - = 0 . 5000 0 . 4207 0 . 0793 1)
Example 3 • Consider how far out in the tail of the distribution of the sample meanis $120 æ - ö 120 109 ³ = z = ; z P ( x 120 ) P ç ³ ÷ è ø 2 . 83 = ³ P ( z 3 . 89 ) = 0.5000 - 0.4999 = 0.0001 x - s n 2) • To investigate the claim, we need to examine how likely an observation is the sample mean of $120 • Since the probability is so small, this suggests the observation of $120 is very rare (if the mean cost is really $109) • There is evidence (the sample) to suggest the claim of = $109 is likely wrong