Download
1 / 4
40 likes | 166 Views
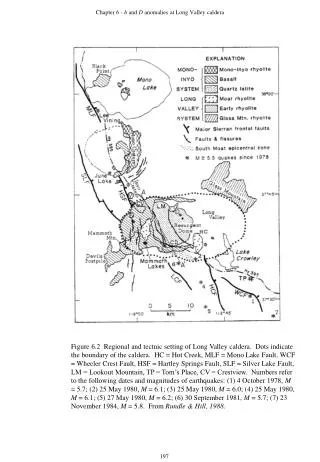
Chapter 6 - b and D anomalies at Long Valley caldera. Figure 6.2 Regional and tectnic setting of Long Valley caldera. Dots indicate the boundary of the caldera. HC = Hot Creek, MLF = Mono Lake Fault, WCF = Wheeler Crest Fault, HSF = Hartley Springs Fault, SLF = Silver Lake Fault,

E N D
Chapter 6 - b and D anomalies at Long Valley caldera Figure 6.2 Regional and tectnic setting of Long Valley caldera. Dots indicate the boundary of the caldera. HC = Hot Creek, MLF = Mono Lake Fault, WCF = Wheeler Crest Fault, HSF = Hartley Springs Fault, SLF = Silver Lake Fault, LM = Lookout Mountain, TP = Tom’s Place, CV = Crestview. Numbers refer to the following dates and magnitudes of earthquakes: (1) 4 October 1978, M = 5.7; (2) 25 May 1980, M = 6.1; (3) 25 May 1980, M = 6.0; (4) 25 May 1980, M = 6.1; (5) 27 May 1980, M = 6.2; (6) 30 September 1981, M = 5.7; (7) 23 November 1984, M = 5.8. From Rundle & Hill, 1988. 197
Chapter 6 - b and D anomalies at Long Valley caldera Figure 6.3 Schematic northwest - southeast cross-section through Long Valley caldera. Heavy lines represent approximate positions of reflecting boundaries indentified by Hill et al. (1985) and Luetgert & Mooney (1985). From Hill et al, (1985). 198
Chapter 6 - b and D anomalies at Long Valley caldera Figure 6.19 A model for the deformation of Long Valley during the swarm of January 1983. From Denlinger et al.(1985). 223
Chapter 6 - b and D anomalies at Long Valley caldera Figure 6.20 Map of the Casa Diablo area showing geothermal production and injection wells supplying three geothermal power plants. Mapped faults are from Bailey(1989) and unpublished mapping by J. F. Howle. TBF denotes Taylor-Bryant fault. From Sorey et al. (1995). 226