Download
1 / 17
170 likes | 274 Views
Frequent rain observation from geostationary satellites by millimetre-submillimetre-wave sounding Bizzarro Bizzarri, CNR Istituto di Scienze dell’Atmosfera e del Clima, Italy Albin Gasiewski, NOAA Environmental Technology Laboratory, USA

E N D
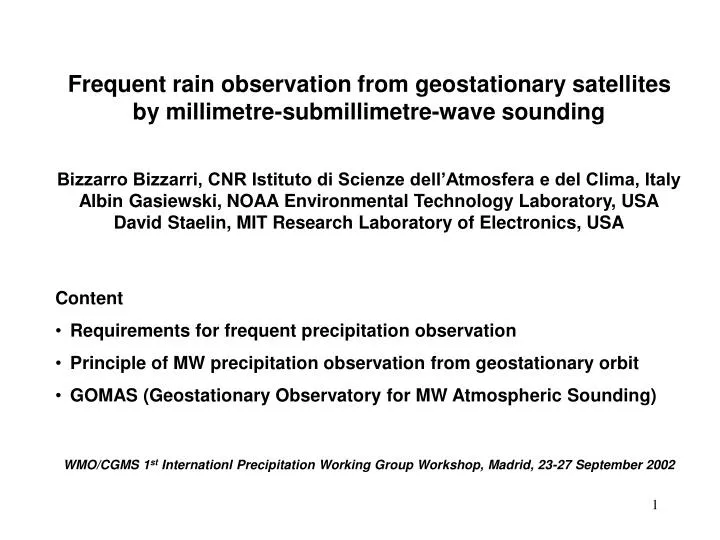
Frequent rain observation from geostationary satellites • by millimetre-submillimetre-wave sounding • Bizzarro Bizzarri, CNR Istituto di Scienze dell’Atmosfera e del Clima, Italy • Albin Gasiewski, NOAA Environmental Technology Laboratory, USA • David Staelin, MIT Research Laboratory of Electronics, USA • Content • Requirements for frequent precipitation observation • Principle of MW precipitation observation from geostationary orbit • GOMAS (Geostationary Observatory for MW Atmospheric Sounding) • WMO/CGMS 1st Internationl Precipitation Working Group Workshop, Madrid, 23-27 September 2002
The problem of measuring precipitation • The most long-standing practise makes use of VIS/IR image sequences from GEO: • The observing frequency is suitable (15 min with MSG) • The measurement is strongly indirect (VIS/IR only “sees” the cloud top) • The applicability is mostly addressing convective precipitation. • From LEO, MW images are used (from SSM/I, TRMM, in the near future GPM): • The measurement is direct for low frequencies (10 GHz), less for high frequencies (90 GHz) • The applicability is better for convective precipitation, but extends to all precipitation types • The frequency, with GPM, will be around 3 hours • Global scale will be served optimally, regional scale to a fair extent • For the mesoscale, fusion between LEO MW images and GEO VIS/IR images will be attempted. • The ideal would be to extend the MW imagery technique to the geostationary orbit, but: • The antenna diameter for a 10-km resolution is 15 m at 90 GHz, 35 m at 37 GHz, 70 m at 19 GHz • Polarisation diversity is not practical from the geostationary orbit (large and variable z-angle). • GEO requires using higher frequencies and exploiting a different physical principle.
The physical principle for measuring precipitation from GEO • MW observation from LEO makes use of “atmospheric windows”: • Most common frequencies: 6 GHz, 10 GHz, 19 GHz, 23 GHz, 37 GHz, 90 GHz, 150 GHz • Dual polarisation for roughness effects (over the sea) and scattering from ice (over land). • The proposed principle for GEO exploits absorption bands: • Profiles of temperature and humidity are measured by more bands at different frequencies • Profiles observed exploiting bands of different frequencies are differently sensitive to clouds • Absorption bands at very high frequencies enable using antennas of affordable size • It is not necessary to differentiate polarisations • In absorption bands the measurement is equally effective over sea and land. • The precipitation measurement passes through the sounding one, therefore: • Many more channels are needed, very narrow (< 1 ‰), with SNR > 100 • In exchange, one simultaneously gets: • - the temperature vertical profile (also inside clouds) • - the humidity vertical profile (also inside clouds) • - the columnar content (or gross profile) of liquid water in the cloud • - the columnar content (or gross profile) of ice water in the cloud • - the precipitation.
Multi-channel image from an airborne radiometer (Gasiewski et al, 1994). Note: • In absorption bands (183 and 325 GHz) increasing cloud impact moving from the peak to the window (from 183 1 to 183 3 and 183 7; and from 325 1 to 325 3 and 325 9); • In windows (89, 150, 183 7, 220 e 325 9) increasing cloud impact with increasing frequency.
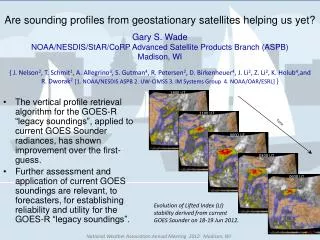
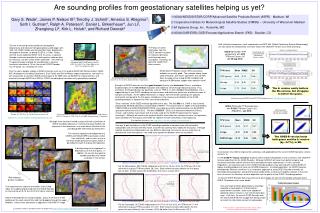
Precipitation images from a cold front on October 7, 1998: NEXRAD precipitation map smoothed to 15 km resolution (left image), and NOAA/AMSU precipitation map obtained using a neural net retrieval technique (right image) (Staelin and Chen, 2000).
NOAA-15 AMSU-B 183+/-7 GHz 15-km resolution imagery of small rain cells over the Eastern U.S on August 2, 2000 (from Staelin and Chen, 2000).
Comparison between the 118/54 GHz profile ratio from the NAST-M microwave radiometer being flown on the NASA ER-2 aircraft and simultaneous EDOP Doppler radar reflectivity observation. Hurricane Bonnie at 17 GMT on August 26, 1998(Tsou et al, 2001). The ratio 118/54 is unit in the absence of precipitation or above the precipitation cell, and reduces in the presence of precipitation because of higher attenuation from drops and impact from ice scattering at the higher frequency. The agreement between the two vertical cross-sections is striking. Horizontal maps of this information from GEO at 15 min intervals, will resemble a proxy rain radar operating over continental field of view, particularly over oceans and mountainous terrain.
Atmospheric spectrum in the MW/Sub-mm range (Klein and Gasiewski, 2000). Preferred bands - for O2 (temperature): 54 GHz, 118 GHz, 425 GHz; for H2O: 183 GHz, 380 GHz.
Incremental Weighting Functions (IWF) for the selected channels in the bands of oxygen (54, 118 and 425 GHz) and of water vapour (183 and 380 GHz). Note that the sensitivity of 380 and 425 GHz drastically drops in lower troposphere (Klein and Gasiewski, 2000).
Reference user requirements adopted for GOMAS Resolution v/s frequency and antenna diameter
GOMAS (Geostationary Observatory for MW Atmospheric Sounding) European sector (1/12 of disk) scanned each 15 minutes Temperature vertical profile, all-weather and inside clouds: resolution 30 km Humidity vertical profile, all-weather and inside clouds: resolution 20 km Columnar content or gross profile of liquid and ice water: resolution 20 km Precipitation: resolution 10 km.
Radiometric performance assessment for 15 min observing cycle
3” Thick Composite Reflector Nodding / Morphing Subreflector Space Calibration Tube Receiver Package 50-430 GHz Feeds Thin Struts Elevation Motor & Compensator Azimuth Motor & Compensator Backup Structure The GOMAS instrument with its 3-m antenna
NORTH DIRECTION Solar Wing Space Calibration Tube S-band Antenna for TT&C 3 -meter Antenna NADIR S-Band Antenna for TT&C Star Sensors S-band antenna for LRIT The GOMAS satellite • Mass: 860 kg (“dry": 430 kg) • Electrical power: 500 W • Volume: 3.0 x 3.0 x 3.0 m3 • Data rate: 128 kbps (S-band, compatible with MSG LRIT).
List of Proponents of GOMAS (undertaking to implement the scientific programme) P.I.: Bizzarro BIZZARRI, for the CNR Istituto Scienze dell'Atmosfera e del Clima, Roma, Italy
Conclusions • Strong requirements exist for frequent precipitation observation. • From GEO, a new physical principle needs to be exploited. • GOMAS is proposed as a demonstration mission. • It would be a precursor for future operational applications. • From the technical standpoint, and building on the studies conducted in the U.S. on GEM, it is believed that no enabling technology is currently missing. • The GOMAS satellite could be developed in time for a launch in the 2007-2009 timeframe. • It would provide simultaneous retrieval of: • - temperature profile (x 30 km) • - humidity profile (x 20 km) • - cloud liquid/ice water total column and gross profile (x 20 km) • - precipitation rate (x 10 km) • each 15 minutes ! over 1 / 12 of the disk covering sea and land !