Download
1 / 7
70 likes | 178 Views
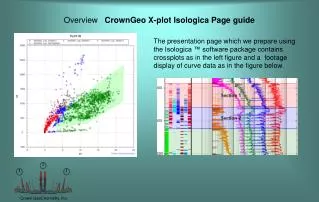
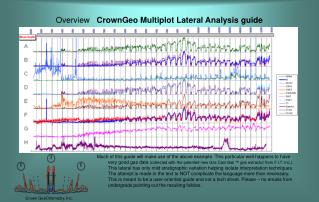
Dive into the core analysis of well lateral behavior with our CrownGeo Pathplot guide. This essential resource illustrates key components of lateral data interpretation, including MD vs. TVD well path tracing, gamma data correlation, and normalization of hydrocarbon values (C1, C4, Lts, Mids). With detailed graphical displays, this guide enhances understanding of gas volume estimates free from drilling artifacts. Gain insights from crossplots to identify compartment boundaries, facilitating effective decision-making in hydrocarbon extraction. Essential for geoscientists and drilling engineers alike.

E N D
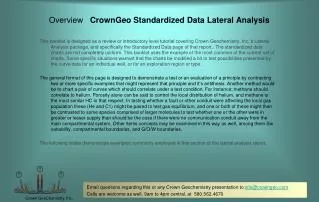
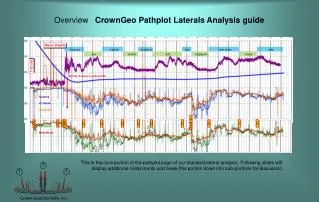
Arrival to source rock profile Gamma C1 Norm C4 Norm Lts Norm Mids Norm Overview CrownGeo Pathplot Laterals Analysis guide This is the core portion of the pathplot page of our standard lateral analysis. Following slides will display additional components and break this portion down into sub-portions for discussion. Crown GeoChemistry, Inc. marked numbered then with these aids Sections and/or are and displayed visual CB TRIP TRIP TRIP CB CB CB CB CB CB CB CB CB CB TRIP
TVD/MD and GammaCrownGeo Pathplot Laterals Analysis guide In this track is the MD vs. TVD well path trace as the bold blue line, with TVD as the Y axis and MD as the X axis. The purple data line is gamma from MWD. The gamma scale is simply set so that the range fits in the track and it gives the user a familiar visual correlation between this data and other data. The blue line slants down the page initially , this is the vertical portion of the well and while vertical we gain as much TVD as MD so the line moves as far OVER as it does DOWN. Later , when we land, the path moves along the lateral MD axis as hole lengthens and drifts up and down the vertical TVD axis as we porpoise along. Crown GeoChemistry, Inc.
Increasing value Normed C1 and C4CrownGeo Pathplot Laterals Analysis guide This track contains two data curves based on C1 and C4 where C1 is blue and C4 is Orange. In some cases, as here, the curves each have a moving average trend line written over them to help see around connection gases and the like. The curve scales are set with C1 having it’s max sustained value for the well as full scale, and C4 set in similar fashion. C4 is often then adjusted so that the largest portion that can be made to do it will match the C1 span as perfectly as can be set. Note that for much of this lateral the lines approximately overwrite each other. However the C1 outruns the C4 in a few places, most notably at the higher C1 value ranges but also in some of the median value ranges The C1 and C4 values used for these curves are normalized values. We normalize for volume so that we can look at data without looking through artifacts of the drilling rig or drilling process. The concept is simple enough. We take a wet hydrocarbon , generally C7, and we determine a median value for it to use as the target value. Then for every data point the C7 gets pushed up or down so that it’s value becomes equal to the target. Whatever correction is required to make the C7 adjustment is then also applied to C1 and C4. Pushing C7 to a straight line and adjusting C1 and C4 by the same factor – that simple. This is a simple and highly effective way to estimate the gas volumes to approximate having had no drilling artifacts. Nothing about this analysis hinges on this conversion. The conversion makes the data easier to see in some cases. In less problematic data sets the conversion is hardly discernible from simply using raw C1 and C4 numbers. C1normC4norm Crown GeoChemistry, Inc.
Normed Lights and MidsCrownGeo Pathplot Laterals Analysis guide This track is very similar to the C1 and C4 norm track in the prior slide. Please read that slide before this one. Here the curves are comparing lightest hydcs again, but instead of purely C1 the light hydc curve is a blend of C1, C2, and Helium. The midrange hydc curve is a blend of C4 and C5. In most cases this data will mimic the other curve. The differences where they occur can be instructive. The concept is still most volatile being compared to most abundant of the larger hydc molecules. One of the obvious differences in the curve itself is the He component. Another difference is the C5 component. This set of data tends to be better suited than the pure C1-C4 in lower abundance gas situations and for cases like very mature shale that have a very high ratio of methane to heavier hydcs. In this particular example there is really no difference between the two versions of the concept. When very similar we still plot the data for continuity, and to show when they are indeed that similar. Lts_normMids_norm Crown GeoChemistry, Inc.
Example CrossplotsCrownGeo Pathplot Laterals Analysis guide Several samples of these crossplots are usually appended to the top of the Pathplot panel. There should be one for each indicated boundary. The example for each boundary is selected for relevance or degree of emphasis it can display. The crossplot work is a core element in our compartmental determination method. The actual process involves testing any perceived change using several tests at each depth range, and we put an illustrative example as a reference on this report. The actual full crossplots set is included as another distinct report element itself as well. Also please see our separate guide concerning crossplots and our usage. The key concept in a nutshell is that we are testing for alikeness, and suggesting boundaries based on continuity of that alikeness. Crown GeoChemistry, Inc.
E Section G Sec D Sec F CB CB CB CB TRIP Sectional mapCrownGeo Pathplot Laterals Analysis guide Sections are determined using crossplots, curves analysis etc. and are then drawn as at left for a visual reference of our findings. In the example at left it can be seen readily that the curve data have different relative magnitudes, and/or that their ratios change at about the spots indicated as CB. Note that the Sec F anomaly is a good fit to the low-gamma portion of the lateral. The gamma change indicates a stratigraphic change, and the resulting mass spec profile change agrees. That the mass spec data is different suggests lack of or incomplete communication across the stratigraphy for the volatile gas components. Crown GeoChemistry, Inc.
Sec. 1 Section 2 Section A Arrival to source rock profile Summary; Section 1 to Section 2 boundary is very interesting commentary here has very good indications of being a interesting commentary here. Sections 2, interesting commentary here have the best general hydc abundance which could indicate better interesting commentary here Gamma C1 Norm C4 Norm Lts Norm Mids Norm CB CB CB Summary CrownGeo Pathplot Laterals Analysis guide A brief of the summary points is provided on the pathplot page. That summary is a portion of the section by section detail which accompanies the crossplot data presentation. Depending on the data, combined with what we may have come to understand about the region, and the wishes of the customer this commentary will be the “in a nutshell” highlights of what we infer the data to be suggestive of. In addition to the “pathplot” page discussed in this presentation guide and the multiplot page (see separate guide also available on this website) there is a third page, which compares CO2 and Methane. The sectional map for the well is reproduced as well, allowing an examination of CO2 and C1 which is sometimes quite instructive. Crown GeoChemistry, Inc.