Download
1 / 71
710 likes | 903 Views
Money. In the absence of money, goods and services are exchanged in a barter system where individuals directly exchange the surplus from the fruits of their labor.

E N D
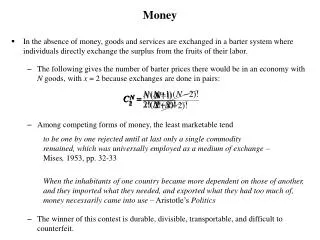
Money • In the absence of money, goods and services are exchanged in a barter system where individuals directly exchange the surplus from the fruits of their labor. • The following gives the number of barter prices there would be in an economy with N goods, with x = 2 because exchanges are done in pairs: • Among competing forms of money, the least marketable tend to be one by one rejected until at last only a single commodity remained, which was universally employed as a medium of exchange – Mises, 1953, pp. 32-33 When the inhabitants of one country became more dependent on those of another, and they imported what they needed, and exported what they had too much of, money necessarily came into use – Aristotle’s Politics • The winner of this contest is durable, divisible, transportable, and difficult to counterfeit.
Money Gold coins in 1776-Colonial America • Commodity Money: • The ShawshankRedemption • In Time • Paper Money is backed by a commodity • Iron Chinese coins were used as currency Szechwan, China (Lui, 1983) • In the 10th century, their bank receipts (chiao-tzu) circulated as paper money • Chiao-tzu became fiat moneyafter the Szechwan gov’t took it over in 1023 Stone Money, Island of Yap “Tiger Tongue” from Siam, Bronze Coin • Coat check tickets?
Money • Paper Money backed by Gold
Money l Fiat • Paper Money backed by Gold
Money • Paper Money is government decreed money. Fiat • Louisiana House Bill 195 bans cash on all second-hand transactions, which passed near unanimously with one nay vote in the senate. (www.forbes.com)
Quantity Theory of Money Irving Fisher’s equation of exchange Mainstream economics defines inflation as a general increase in the prices of products p = (PLis – PLwas) /PLwas • Excessive growth in the quantity of money • Demand-pull inflation • Cost-push inflation > 0
Quantity Theory of Money Velocity of money is constant in short run • Unemployment is too low • w and p rise ,u= un and the Fed lowers ito increaseM 15.5 LRAS 14.5 AD SRAS 16 15
Quantity Theory of Money Velocity of money is constant in short run • Unemployment is too low • w and p rise ,u= un and the Fed lowers ito increaseM • the PLincreases • No affect on GDP 16.5 15.5 LRAS 14.5 AD SRAS 16 Inflation is always and everywhere a monetary phenomenon in the sense that it is and can be produced only by a more rapid increase in the quantity of money than in output. Milton Friedman 15
Quantity Theory of Money Sources: For panel (a), Milton Friedman and Anna Schwartz, Monetary trends in the United States and the United Kingdom: Their Relation to Income, Prices, and Interest Rates, 1867–1975, Federal Reserve Economic Database (FRED), Federal Reserve Bank of St. Louis, http://research.stlouisfed.org/fred2/categories/25 and Bureau of Labor Statistics at http://data.bls.gov/cgi-bin/surveymost?cu. Source: IFS data for 120 countries, averaged over years 1996-2004
Quantity Theory of Money High Money Growth & low inflation Sources: FRED, Federal Reserve Economic Data, Federal Reserve Bank of St. Louis; Bureau of Labor Statistics, http://research.stlouisfed.org/fred2/categories/25; accessed September 30, 2010.
Quantity Theory of Money … but high money growth is followed by accelerating inflation Sources: FRED, Federal Reserve Economic Data, Federal Reserve Bank of St. Louis; Bureau of Labor Statistics, http://research.stlouisfed.org/fred2/categories/25; accessed September 30, 2010.
Money Demand Fisher’s money demand (from Quantity Theory of Money): Fisher’s demand for money is not affected by i. MDFisher i 3.5 1900 2300M
Money Demand Keynes’ money demand (from Liquidity Preference Theory): people’s motives for holding money include transactions, precautionary, and speculative. MDFisher i 3.5 MDKeynes 1900 2300M
Money Demand Friedman’s money demand (Permanent Income Hypothesis): Permanent income (LR average of current & future income) links ito Md because people speculate that iwill rise in the future if it is low today. MDFisher i 3.5 MDKeynes MDFriedman 1900 2300M
Money Demand The compromise: MDFisher i 3.5 MDKeynes MD MDFriedman 1900 2300 M 2300
Money Demand The compromise: • The lower the nominal interest rate, the lower the opportunity cost of holding money, the greater is the quantity of real money demanded. i 3.5 2.5 MD 1900 2300 M 2300
Money Demand The compromise: • The lower the nominal interest rate, the lower the opportunity cost of holding money, the greateris the quantity of real money demanded. • M rises by 5% if PL rises by 5% • real GDP (+) • Financial technology: ATM, debit cards, interest checking i 2.5 MD 1900 2300 M
Money Demand The compromise: • The lower the nominal interest rate, the lower the opportunity cost of holding money, the greateris the quantity of real money demanded. • M rises by 5% if PL rises by 5% • real GDP • Financial technology: ATM, debit cards, interest checking credit cards i 2.5 MD 1900 2300 M
Historical Development of the Banking System Money Supply
Bank of North America chartered in 1782 Controversy over the chartering of banks. National Bank Act of 1863 creates a new banking system of federally chartered banks Office of the Comptroller of the Currency Dual banking system Government’s perspective The Mises Institutes’ perspective Free Banking (Lawrence White) Free Banking (Lawrence White) Free Banking The Mises Institute’s perspective Money Supply Historical Development of the Banking System
Money Supply Historical Development of the Banking System Federal Reserve System created in 1913
Money Supply • The Federal Open Market Committee (FOMC) • Includes 7 BOG members, the NY Fed Bank president, & 4 of the 11 other district bank presidents • meets once every six weeks (on Tuesdays) to set monetary policy for the Fed: • low steady inflation: 2-3 percent per year (but $1 ≈ 1₵ after 100 years) • full-employment • u= un → Y≈ Yp • u declines because The Chair is Oz: The Great and Powerful • Spokesperson for the Fed and negotiates with Congress and the President • Sets the agenda for meetings • Speaks and votes first about monetary policy • Is it wise to have one person with this much power? The curious task of economics is to demonstrate to men how little they really know about what they imagine they can design. F.A. Hayek
Money Supply • The Fed sets the required reserves ratio on checkable demand deposits • This makes banks’ T-accounts slightly different than the goldsmith’s • The bank has lent money to • Consumers • Businesses • Government • The bank has lent out all but $10,000 of the $50,000 in checkable demand deposits. • Reserves equal the sum of required reserves (RR) & excess reserves (RE) • The Fed requires banks to hold (or place on reserve) 10% of their checkable deposits • The remaining money that is not lent out is called excess reserves
Money Supply Nonbank Public’s Balance Sheet The Fed’s Balance Sheet High-powered money or The Monetary Base (MB) $3.6 trillion in 2014
Money Supply Simple money multiplier The Fed buys $100 million worth of First National’s Treasury bonds and the reserve requirement ratio is 10% simple money multiplier
Money Supply Simple money multiplier The Fed buys $100 million worth of First National’s Treasury bonds and the reserve requirement ratio is 10% simple money multiplier
Money Supply The money multiplier:
Money Supply The money multiplier: The simple money multiplier:
Money Supply • The consensus view: • It is the relationship between the quantity of money supplied and i. • Quantity of money supplied is determined by bank lending and the Fed. • On any given day, the quantity of money is fixed independent of the interest rate. MS i 3.5 2.5 1900 2300M
The Market for Money • Interest Rate Adjustment • When the interest rate is above its equilibrium level, the quantity of money supplied exceeds the quantity of money demanded (or needed). • People hold too much money, so they try to get rid of it by buying other financial assets. • The demand for financial assets increases, the prices of these assets rise, and the interest rate falls. MS i 3.5 2.8 MD 1900 2300M 1800
The Market for Money • Interest Rate Adjustment • When the interest rate is below its equilibrium level, the quantity of money demanded (or needed) exceeds the quantity of money supplied. • People are holding too little money, so they try to get more money by selling other financial assets. • The demand for financial assets decreases, the prices of these assets fall, and the interest rate rises. MS i 2.8 2.5 MD 1900 2300M 2000
Equilibrium Quantity of Money M2 (right) C (right) M1 (right) Re(left) MB (left) http://research.stlouisfed.org/fred2 http://research.stlouisfed.org/fred2
Demand for Reserves • Quantity Demanded for Excess Reserves ( ) provide banks with insurance against big withdrawals (caused by bank runs) • The federal funds interest rate (iff) is the cost of “big withdrawal” insurance. • The cost of excess reserves is the opportunity cost of not making loans. • If iff falls, the cost of excess reserves falls (the cost of big withdrawal insurance). • Thus banks are more willing to purchase more “big-withdrawal” insurance • Demand for Excess Reserves: • S = shock parameter, which increases if • in government intervention (e.g., w & p controls) because interfering with price signals can stifle innovation & entrepreneurialism. • in economic growth (default risk is lower & C&I lending rises) • r is adjusted up or down • During bank panics
Demand for Reserves • Quantity of Required Reserves (RR) • The Federal Reserve (the Fed) requires banks to hold (not lend out) a percentage of the total amount of checkable deposits in their vaults (D) • The percentage required is called the required reserves ratio (r) • Thus the quantity of required reserves is • Quantity Demanded for Reserves ( ) is • Demand for Reserves: Slope =b= 1
Demand for Reserves • Example: Suppose r = 0.1, D = 50 (billion $), S = 25, and b = 1. Graph the demand for reserves in the graph below. Federal Funds Market iff 5 2 DR 25 28 Q
Supply for Reserves RN + RB = 28 + 0 = 28 • The supply curve has two components • vertical part: • horizontal: • Example: Suppose RB = 0 (billion $), RN = 28 (billion $) and id = 3 (percent). id = 3 Federal Funds Market iff 3 SR DR 28 Q
Federal funds market equilibrium The equilibrium occurs when demand intersects supply, which can occur on the • Vertical section of supply (Normal Mode) • Horizontal section (Emergency Mode) = 2 28 Federal Funds Market iff 3 SR Equilibrium 2 DR 28 Q
Discount Rate • Example(continued): Suppose the Fed increases the discount rate to 3.3 (percent). Show the affect of this policy change in the figure below. Federal Funds Market The horizontal section id = 3.3 iff SR 3.3 The vertical section no change 3 SR Starting on 1/1/03 the Fed began setting the discount rate 100 basis points (1 pct. point) above its federal funds rate target 2 DR 28
Required Reserves Ratio • Example(continued):Instead, suppose the Fed increases the required reserve ratio to 14%. Show the affect of this policy change in the figure below. When ris adjusted up or down S increases 26 .14 Federal Funds Market iff 5 3 SR DR The new equilibrium: iff = 3 2 DR 28 30
Required Reserves Ratio • Example(continued):Instead, suppose the Fed increases the required reserve ratio to 14%. Show the affect of this policy change in the figure below. In the past, the Fed has tried slowing the economy by increasing r. Doing this creates a big collapse in bank lending to businesses and consumers. In addition, the Fed has to make discount loans to banks. So even though total reserves have increased via discount lending ($2 billion in the diagram above), this cash is sitting idle. The effect is a reduction in money supply. Federal Funds Market iff 5 3 SR DR 2 DR 28 30
Required Reserves Ratio • Example(continued):Instead, suppose the Fed increases the required reserve ratio to 14%. Show the affect of this policy change in the figure below. Money MS’ MS This increases r provided inflation remains unchanged. i1 i0 MD M1 M0
Required Reserves Ratio • Example(continued):Instead, suppose the Fed increases the required reserve ratio to 14 (percent). Show the affect of this policy change in the figure below. Higher r decreases I and X, and both of these collapse AD. This results in lower prices and real GDP. In the past, small increases in r have put a “hot” economy (one that is growing too fast) into a recessionary gap. The Fed has not changed the r since 1992 AD-AS-YFE AS PL0 PL1 AD AD’ Y1 YF Y0
Open Market Operations • The Fed conducts an Open Market Purchase (OMP) by buying Treasuries from banks • Cash flows from the Fed to Banks • The quantity of reserves in the federal funds market rises • The federal funds interest rate declines • This isexPansionary monetary policy • The Fed conducts an Open Market Sale (OMS) by selling Treasury bonds to banks • The Fed has bonds to sell because it purchased them directly from • Treasury in the primary market (this is called monetizing the debt) • Banks in the secondary market in a previous OMP • Banks give cash (reserves) to the Fed in exchange for Treasury bonds • The quantity of reserves in the federal funds market declines • The federal funds interest rate increases • This isreStrictive monetary policy
Open Market Purchase • Example(continued):Instead, suppose of changing id or r the Fed performs an OMP by buying a half of a billion dollars worth of bonds from banks (RN = 28 + .5 = 28.5). Show the affect of this policy change in the figure below. Federal Funds Market The horizontal section no change iff The vertical section RN + RB = (28 + .5) + 0 = 28.5 3 SR SR 2 New equilibrium 1.5 DR 28 28.5 Q
Open Market Purchase • Example(continued):Instead, suppose of changing id or r the Fed performs an OMP by buying a half (billion $) worth of bonds from banks. Show the affect of this policy change in the figure below. Federal Funds Market Starting on 1/1/03 the Fed began setting the discount rate 100 basis points (1 pct. point) above its federal funds rate target. iff 3 SR SR 2 1.5 DR 28 28.5 Q
Open Market Purchase • Example(continued):Instead, suppose of changing id or r the Fed performs an OMP by buying a half (billion $) worth of bonds from banks. Show the affect of this policy change in the figure below. Federal Funds Market Starting on 1/1/03 the Fed began setting the discount rate 100 basis points (1 pct. point) above its federal funds rate target. So the Fed lowers the discount rate to 2.5 iff 3 SR SR 2.5 SR 1.5 DR 28 28.5 Q
Open Market Purchase • Example(continued):Instead, suppose of changing id or r the Fed performs an OMP by buying a half (billion $) worth of bonds from banks. Show the affect of this policy change in the figure below. Money Increased RN means banks have more cash to lend to consumers and business. The money supply increases via increased lending If m = 4, then DMS= 4(0.5) DMS = 2 If inflation remains unchanged,r will fall too, increasing I (and X). MS MS’ 3.85 2.75 MD 500 502
Open Market Purchase • Example(continued):Instead, suppose of changing id or r the Fed performs an OMP by buying a half (billion $) worth of bonds from banks. Show the affect of this policy change in the figure below. AD-AS-YFE Increases in I and X, and lower r increase AD. This results in higher GDP, lower unemployment, and higher prices AS 225 215 AD’ AD 14 15
Open Market Sale • Example(continued):Suppose the Fed performs an OMS by selling a half of a billion dollars worth of bonds to banks (RN = 28 – .5 = 27.5). Show the affect of this policy change in the figure below. Federal Funds Market The horizontal section no change iff The vertical section RN + RB = (28 –.5) + 0 = 27.5 3 SR SR 2.5 2 New equilibrium DR 27.5 28 Q