Download
1 / 61
690 likes | 1.2k Views
Reliability and Failure Analysis of Electronic Components. By Dr. Charles Surya, ENC CD 636, ×6220 ensurya@polyu.edu.hk. For VLSI Circuits to be a useful and growing technology, 2 conditions must be satisfied: Can be produced in large quantities at low cost

E N D
Reliability and Failure Analysis of Electronic Components By Dr. Charles Surya, ENC CD 636, ×6220 ensurya@polyu.edu.hk
For VLSI Circuits to be a useful and growing technology, 2 conditions must be satisfied: Can be produced in large quantities at low cost Cats can perform their functions throughout their intended lifetime To lower the cost of manufacturing, one must determine the optimal size of the IC. The optimal size is a compromise between several competing considerations: Partitioning of the system yield of good circuits packaging and system assembly cost reliability of complete system Large number of IC’s results in high yield and assembly cost To arrive at an optimal division of the system, we must be able to predict the total system reliability as a function of the number of IC’s of varying size
Mechanism of Yield Loss in VLSI • Cause for low yield falls into 3 basic categories: • Parametric processing problems • CKT design problems • random point defects in circuits Processing Effects • Often a wafer is divided into regions good chips and bad chips (Fig. 1 p. 614, Sze) • This is most likely due to processing effects such as • Variations in thickness of oxide or polysilicon layers • Variations in resistance of implanted layers • Variations in width of lithographically defined features
Alignment of photomasks • e.g. PolySi gate lengths are shorter in thinner polySi regions than in thicker polySi regions. This may cause channel lengths to be too short and transistors cannot be turned off. This leads to excessive leakage current • Variations in thickness of deposited dielectric lead to variations in contact window size. This may lead to non-operative circuits if the circuits depend on having a low value of contact resistance. • Variations in the doping of implanted layers which also leads to variations in contact resistance • Also, wafer may vary in size during processing in excess of 20ppm. Therefore a 125 mm wafer changes in size by 2.5mm. This may cause significant misalignment.
Circuit Sensitivities • Certain areas of a wafer have low device yield because the design of a ckt has failed to consider expected variations in device parameters and correlation between variations in different parameters. Point Defects • A 3 m dust can cause a break in a metal conductor • Si chunks may be knocked out of the wafer during processing • Isolated oxidation induced stacking fault may cause excessive leakage current Modeling of Yield-loss Mechanisms • We need to model IC yield in terms of fundamental parameters independent of particular IC and characteristics of the process and processing line because: • by accurately modeling the yield we can predict the cost and availability of future ckts
once yield-modeling parameters are known one can compare processing quality of different process lines and indicate where improvements are required • IC yield is expressed as Y=Y0Y1(D0,A,i) • 1-Y0 = fraction of bad chips due to processing related effects 1-Y1 = remaining fraction of bad chips which is a function of density of point defects • A is the chip area • i is the parameter unique to different models of the yield • Y = ratio of good chips to total number of chips per wafer • All models predict Y decreases monotonically as A increases • Yield modeling can identify those processes and mechanisms that limit yield of present IC • The process can then be improved or eliminated as needed
Uniform Density of Point Defects • In those areas where yield not degraded by either processing or ckt sensitivities, the remaining cause of chip failure is randomly distributed point defects (see See p. 617, 618) • A grid of 24 chip sites with 10 defects randomly distributed. In this example 16 of the 24 sites have 0 defects • Of the remaining sites 6 have 1 defect no site has more than 2 defects • The problem of determining the yield is identical to the problem of placing n balls in N cells and then calculating probability of a given cell containing k balls P k = (n!)/[k!(n-k)!] (1)/(Nn)(N-1) n-k • If N and n are both large n/M = m remains finite and can be approximated as Pk =e-mmk /k! • The probability that a chip contains no defects is Y1 = P0 = e-m • The probability a chip contains 1 defect is P1 = me-m
If the area of the chip is A, the total chip area in the useable part of a wafer is NA • The density of defects is n/NA = D0 • The average number of defects per chip, m, is m = n/N = D0 NA/N = D0 A Y1 = P0 = exp(-D0 A) • This Poisson estimation was used to predict yield in the early days in the manufacture process • The actual yield was found to be much larger than predicted
Yield Enhancement using Redundant Circuitry • Many large MOS memory chips are designed with redundant circuitry, which can be switched to replace defective circuit elements • This is usually accomplished using fusible links which can be fused as needed using laser or other techniques • The yield will then be modified as shown • Y1 = P0 + P1 • P0 = probability of chip containing no defects • P1 = probability of chip containing 1 defect • = probability of chip containing 1 defect and can be repaired by using a single redundant column Simple Non-uniform Distribution of D • Discrepancy between measured and predicted yield led to investigation of non-uniform distribution of D0 across a wafer
The yield can be expressed as • The yield is expressed as Y = exp(-DA) f(D) dD • f(D) is the normalized distribution of defect density f(D) dD = 1 • 3 different D0 are investigated: • Delta function Y1 = exp(-D0A) • Triangular Y2 = {[1-exp(-D0A)]/D0A}2 • Rectangular Y3 = {1-exp(-2D0A)}/2D0A • for D0A >> 1 we find that • Y1 = exp(-D0A) • Y2 = 1/(D0A)2 • Y3 = 1/(2D0A) • Y3 is found to be most closely fit to the observed yield of large IC’s • The above distributions do not have any physical basis, therefore more physically based distributions need to be investigated
Gamma Distribution • The Gamma distribution is more physical f(D) = 1/[()() ]D -1 exp(-D/ ) • and are 2 distribution parameters and () is the gamma function • Average density of defects = • Variance of D = 2 • Consequently Y4 = 1/(1+SD0A)1/s • for s 0, Gamma function reduces to delta function and Y4 exp(-D0A) • Using different values of s, Gamma function is a good approximations of Y2 and Y3 over a wide range of D0A • Gamma yield functions can be used to represent a large variations in the shape of experimental yield vs area curve see Fig. 4 and 5 p. 621 and 622 of Sze. • Each type of defect is characterized by • its mean defect density Dn0 • shape factor of its distribution Sn
portion of total chip area An susceptible that defect • Using Gamma yield function Yn = 1/{(1+SnAnDn0)}1/Sn • The overall yield is the product of the yield for each known type of defect Y = Yn for n=1,2,….,N • For a mature process in a well controlled high yield line, all of the major yield-limiting defects have probably been controlled or eliminated. The yield is a product of many terms each approximately 1. • This means SnAnDn0 << 1 ln Y = [-(1/Sn) ln(1+SnAnDn0)] ln(1+SnAnDn0) SnAnDn0 Thus lnY = -AnDn0 Y = exp(- AnDn0) D* = (1/A) AnDn0 Y = exp(-AD*) • Here An is the total chip area susceptible to the particular defect
Reliability Requirements for VLSI • It is instructive to consider examples of the effects of device failure • Early discrete solid state computer systems typically consisted of 105 transistors per system • If 1 device failure per month is set as the minimum acceptable condition then the failure rate < 1/(105 720 hrs) = 14 10-9failure/device-hour • 1 FIT 1 failure/ 109 device-hour • The objective for the hypothetical system is for < 14 FIT Reliability Theory (Sze p. 627) • Useful mathematical description requires precise definition of the terms • Definitions: • Reliability -- probability that an item will perform a requiredfunction under statedconditions for a statedperiod of time
For an IC the requiredfunction is generally defined by a test program for an automatic test set • Often initial test programs are not complete and the ckts are not tested under “all” required conditions • As new device failure modes are identified, the appropriate tests are included in later test programs • StatedConditions -- comprise of the total physical environments, including mechanical, thermal, electrical …. • Statedperiodoftime -- the time during which satisfactory operation is required Cumulative Distribution Function • If the device is operational at t = 0. The probability that the device will fail at or before t is given by the function F(t) F(t) = 0 t < 0 0 F(t) F(t`) 0 t t` F(t) 1 t
Reliability Function and Probability Density Function • The probability density function is f(t) = dF(t)/dt • The Cumulative distribution function is F(t) = 0tf(x)dx • The reliability function is R(t) = t f (x)dx • Thus f(t) = - dR(t)/dt
Failure Rate • In many applications the quantity of most concern is the instantaneous failure rate • This is often referred to as the hazard rate • Fraction of devices that were good at time t and that fail by t + is given by • F(t + ) - F(t) = R(t) - R(t+ ) • The average failure rate during the time interval, , is • (t) = average failure rate • = 1/ [R(t) - R(t+ )]/R(t) • for 0 • (t) = - 1/R(t) dR(t)/dt = f(t)/R(t) • = f(t)/[1 - F(t)] • = - d[ln R(t)]/dt • R(t) = exp[- 0t (x) dx]
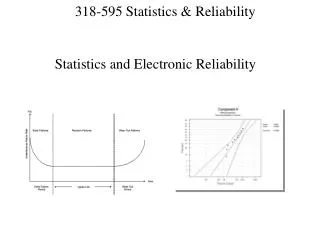
Mean Time to Failure (MTTF)and Common Distribution Functions (p. 630 Sze) • MTTF is a common measure of reliability MTTF = 0 t f(t) dt • It is desirable to have a single mathematical model that represents the failure rate of devices over their entire lifetime • (t) generally varies as a function of time as shown A. High “early failures” or “Infant Mortality” due to manufacturing defects B. “Midlife” or “Steady state” period of low and generally constant failure rate C. “Final” or “wear out” period
Exponential Distribution Function • The simplest distribution function, exponential, is characterized by a constant failure rate over the lifetime of the device. This is useful for representing a device in which all early failure mechanisms have been eliminated • (t) = 0 • R(t) = exp(- 0t) • F(t) = 1 - exp(- 0t) • f(t) = 0exp(- 0t) • MTTF = 0 t 0exp(- 0t) dt
Weibull Distribution • (t) varies as a power of the age of the device = (/)t-1 where and are constants • For < 1 the failure rate decreases with time and can be used to represent early failure • For = 1, (t) is constant and can be usedto represent steady state • For > 1, (t) increases with time and can be used represent wearout condition • For = 1, the failure rate is constant which is a special case of Weibull distribution • R(t) = exp{-(1/)t} f(t) = (/) t-1exp {-(1/)t} MTTF = 1/ (1+1/) where =1. which is linear. The slope of the line is . The MTTF is the time when F(t) = 0.5
In some applications, a better fit can be obtained through the introduction of a 3rd parameter, , in which X = t - is used to replace t in the above equations to represent • a shift by the amount of in the time axis • Physically this represents a portion of device lifetime is used up during manufacturing burn-in or device testing Accelerated Testing • If the required failure rate is ~ 100 FIT or less, then the time required to observe one failure in 100 devices is approximately 100,000 hr (11.4 yrs) • Thus it is impossible to test the required reliability under normal operating conditions • This necessitates means to accelerate the mechanisms that cause devices to fail
5 common stresses are used to accelerate device failure • temperature • voltage • current • temperature cycling to accelerate mechanical failure of chips and assembly package • In such studies, different failure mechanisms may be accelerated by different level of stress even for the same type of stress • A device may fail at normal operating conditions because of 2 completely different mechanisms • Under the applied stress, one of these failure modes may be accelerated much more than the other • Thus, we only see 1 failure mode in those tests • After successfully eliminating the mode we may only the failure rate by small factor under normal operating condition • Adequate studies must be done under normal operating conditions to satisfy that no failure mechanism remain that were not accelerated by the applied stress
Temperature Acceleration • Many failure mechanisms involve chemical or physical processes that can be accelerated by raising the temperature • Ea is the activation energy • If some parameter of IC changes as a function of time, and if the IC fails when the parameter exceeds certain value. • The Rates at two different temperatures are related as • The IC would fail when the destruction reaction proceeds to some value equal to the failure criterion • Rtf = constant • Thus a plot of ln(MTTF) versus 1/T, the slope will correspond to the activation energy
Voltage and Current Acceleration • Voltage and current are effective acceleration stresses • Voltage stress cause failure in devices due to: • dielectric breakdown • interface charge accumulation • charge injection • corrosion • Most studies indicate that the reaction rate, Rx, of the failure mechanism is proportional to a power of the applied voltage • where R0(T) if thermally activated • varies between 1 to 4.5 • For dielectric breakdown, a different type of acceleration occurs • For a given field, a certain fraction of devices fail in a very short time, of the order of seconds • Very few additional failure occurs as the field is maintained • If the applied field is increased, additional fraction failures occur
In such cases, operation at an increased voltage is more in the nature of screening rather than accelerating the failure mechanism • Increased current level is used to accelerate failures caused by electromigration in metallic conductors • 1 < < 4 Stress-Dependent Activation Energy • (T) describes the temperature dependence of the reaction rate • For failure accelerated by voltage or current stressing, the activation energy is dependent on the applied bias • The Eyring model states that • where S = applied stress
Q is related to the Arrhenius activation energy • SB is the breakdown stress, the value of the applied stress where failure of the device occurs essentially instantaneously • The reaction rate can also be expressed as • under conditions of low stress, R reduces to • At high stresses • From the above expressions Reaction Rate is a function of the applied stress, the effective activation energy will decrease with increased rate
Humidity-Temperature Acceleration • Presence of water vapor in the chip environment introduces a new variety of possible failure mechanism • Water vapor quickly permeates plastic packaging material • 1. water vapor transports contaminants from surface of package through the plastic • The chip is then exposed to water vapor and various contaminants • 2. Diffusion of the contaminated water vapor through the passivation layer of the chip • This step can be speeded up if the passivation contains defects or cracks • The penetration of water vapor through the passivation layer determined the reaction rate • 3. Once water reaches the metallization level, electro-chemical corrosion process can occur • The ions needed for this corrosion process can arise from the contaminants which diffused through the passivation layer.
If the intermediate dielectric of the chip is a phosphorous-doped glass, the water vapor can extract the phosphorus from the dielectric • Electrochemical corrosion is a rapid process leading to metallization failure • This failure mechanism can be accelerated by increasing the partial pressure of water vapor in the environment
Burn-in • For mature products, the initial reliability studies would have identified and eliminated failure processes so that steady-state failure rate meets or exceeds design goal • However, the manufactured devices still show existence of continuing early failure • Generally, manufacturing defects cause the infant mortality failures e.g. pinholes, photoresist or etching defects resulting in near-opens or shorts • Contamination on the chip of the package, scratches, weak chips or wire bonds, partially cracked chips or packages • The purpose of the burn-in procedure is to operate the devices for some time during which most of the devices that are subject to • Infant mortality failure actually fail • The conditions during burn-in presumably accelerate the failure mechanisms that contribute to infant mortality failure • Studies of infant mortality under increased T conditions show that infant mortality have an activation energy of 0.37 to 0.42 eV
Properties of Metal-Oxide Silicon (MOS) System • To understand the MOS system the step is to derive the energy band diagram • We note that at thermal equilibrium the Fermi level is constant • The energy band diagram for a separated system is shown below:
When connected the Fermi level will be constant. The Fermi level in Si depends on doping level of the Si • For Ei - Ef = 0.29 eV the band diagram is shown
Strong inversion condition stipulates that qP = qs • Thus to turn an MOS into strong inversion -- a condition for the formation of a conduction channel or inversion layer under the gate, a minimum band bending of 2 qP is required • The threshold voltage VT is then represented by • We can gain further insight into the MOS by realizing that it is basically a capacitor • The charges in the Si of the MOS system can be expressed as • The terms in the square brackets constitute the voltage drop across the oxide. Since part of the charges are associated with the dopants in the depletion layer, therefore free carrier concentration in the inversion layer is
The second term is the charge in the depletion layer VG here is the gate bias required to produce a band bending of 2|P| and is therefore equivalent to the threshold voltage • The proof for the expression of charge in Si is
Where E is the electric field in Si • The total band bending in Si is • From Poisson’s equation we have • For xd = xdmax we have s = 2p and • Charge is the Si layer is qNAxdmax, thus • The total charging voltage is • where
Substituting into the previous equation • From Poisson’s equation we obtain • Concentration of free carriers in the inversion layer is Oxide and Interface Charges • Charges at Si-SiO2 interface and the oxide may influence the threshold voltage through the modifications of the flat-band voltage. If the density of charge at x=x1. It induces an equal and opposite charges divided between silicon of the metal gate. The closer is x1 to xox (the Si-SiO2 interface), the greater will the fraction of induced charges at Si-SiO2 interface and the oxide may influence the threshold voltage through the modifications of the flat-band voltage. If the density of charge at x=x1. It induces an equal and opposite charges divided between silicon of the metal gate. The closer is x1 to xox (the Si-SiO2 interface), the greater will the fraction of induced charge within the Si. • The induced charge changes the charge stored in the Si at equilibrium therefore it alters the flatband voltage. • The size of VFB can be found using Gauss’ law to obtain the value of the gate voltage that causes all of the oxide charge Qoxto be mirrored in the gate electrode.
Under this condition the field is constant between x = 0 and x =x1 and 0 for x > x1. • For 0 < x < x1 we have the following relationship • The result can be generalized to account for shift in VFB using an arbitrary charge distribution • where (x) is the volume charge density at x Origins of Oxide Charges • There are at least 4 distinct types of charges in the oxide-silicon system • Qf’ -- fixed interface charge density • Qot’ -- oxide trapped charge density • Qit’ -- interface trapped charge density • Qm’ -- mobile charge density
Qf’ is positive and is located within a very thin (1 - 2nm) laryer fo non-stoichiometric silicon oxide (SiOx) • Qot’ can be both positive and negative, typically predominantly negative. Located in traps distributed throughout the oxide layer. Distortion in the C-V curve is due to unstable charges at the interface. • The trapping sites Nit (cm-2) are located at the Si-SiO2 interface and have energy levels within the bandgap with density Dit cm-2eV-1 • To relate behavior of these traps to the distorted C-VG, as shown in the following figure, consider an oxide-Si interface characterized by interface trapping levels at energy Es. The gate voltage causes the Fermi level at the surface to cross Es, the charge state of these levels will change. This introduces a voltage dependent term, Q’it/Cox’, into the equation for VFB above making both flatband and threshold voltages vary with VG that led to the distortion the C-V curve. • For Nit > 1010cm-2 is generally unacceptable for reliable device design. Using modern MOS technology, Nit is reduced by annealing device in forming gas (90% N2 and 10% H2)
Mobile charge results from alkali-metal ions particularly sodium. They induce VFB. • The alkali ions have sufficient mobility when relatively low gate biases are applied. The mobility increases with temperature and thus magnifies the problem of VFB instability at high temperatures. The ions are positively charged, therefore -VG draws the ions to the metal-SiO2 intrface where their effect is minimal. +VG pushes them to the Si-SiO2 interface where their effects are most significant. • For voltage stability of 0.1V, less than 2x1010cm-2 mobile ions can be tolerated. Mobile ions can be avoided by careful processing and oxidation in HCl that immobilizes alkali ions. Hot Electron Degradation • The assessment and improvement of reliability on the CKT level should be based on both failure mode analysis and the basic understanding of the physical failure mechanisms. • Processes such as electromigration and electrostatic discharge cause catastrophic changes in device characteristics
Other mechanisms such as hot-electron effects cause non-catastrophic failures which develop gradually over time and change CKT performance Scattering of Channel Hot-Electrons into the Oxide • In order for electrons to obtain enough kinetic energy to be injected into the oxide, it has to • gain K.E. • its momentum redirected towards the oxide through a quasi-elastic collision • following the collision, the electron must travel to S-SiO2 without further collision • These processes are statistically independent, the injection probability is obtained as the product of the probabilities of each event • MOSFET gate current is made up of electrons injected into the gate oxide by quasi-elastic scattering • It consists of electrons that overcome the image potential well in the oxide and reach the gate electrode
Hot Carrier Effects • Advances in VLSI is achieved through down scaling of device dimension such as channel length, junction depth and gate oxide thickness without proportional scaling of power supply voltage • Decrease in device dimensions results in significant increase of the horizontal and vertical electric fields in the channel region • Electrons or holes with high K.E. may be injected into the gate oxide, degrading I-V characteristics of MOSFETs. • This is one of the important factors that limits the maximum achievable device densities in VLSI circuits • Hot-carrier damage results in: • trapping of carriers on defect sites in the oxide • creation of interface states at Si-SiO2 interface leads to degradation in transconductance, shifts in threshold voltage and decrease in drain current capability.
Oxide degradation Mechanism in MOS system • Cause by injection of high-energy electrons and holes into the gate oxide near the drain • The damage is in the form of localized oxide charge-trapping and interface trap generation • Recent experimental evidence shows that hot-carrier related degradation can occur in deep-submicron devices with Leff = 0.15m at drain voltage as low as 1.8V. Therefore hot electron degradation may occur even with significant reduction in drain voltage. • The continuing technology thrust must therefore accompanied by some limitations to ensure hot-electron reliability • Hot-carrier injection causes degradation in the transconductance, shift in threshold and decrease in sub-threshold drain current • There are many disagreement concerning the physical degradation mechanisms due to the lack of a reliable and sensitive techniuqe to evaluate hot-carrier damage at the interface. Moreover, hot-carrier induced oxide damage is very localized, the interpretation of the analysis is complex
Injection of Hot-Carriers into Gate Oxide • Hot-carriers are electrons and holes that have a much higher K.E. than average carrier population • E’s in S.C. at equilibrium mostly have energy about kBT above EC. At equilibrium, K.E. of carriers that encounter large may gain significant K.E. in a short distance. Thus E- EC = kBTe where Te is the effective electron temperature. There are 2 distinct modes of electrons injection in nMOS • Substrate hot-electron effect (SHE) • Channel hot-electron effect (CHE) • Substrate hot-electrons are derived from leakage current. Electrons generated in the channel depletion region or diffusing from the bulk neutral region of the substrate drift toward the Si-SiO2 interface and gain K.E. from the high field in the surface depletion region • The energetic electrons may overcome surface energy barrier and inject into the gate oxide. • Some of the injected electrons are trapped in the oxide, resulting in a relatively uniform oxide charge accumulation that shifts the threshold voltage over time.
The SHE is observed mainly in long-channel MOSFETs. As channel length decreases, SHE decreases since a large fraction of the hot-electrons generated in the substrate region are swept into the source and drain regions instead of the device surface • CHE is more pronounced at large VDS. Electrons reaching Si-SiO2 interface with large K.E. may surmount the energy barrier. Electrons and holes generated by impact ionization also contribute to charge injection into the oxide. Hot-electron current and oxide degradation occurs mainly at the drain end. From the figures, the increased density of equipotential lines leads to larger horizontal field. Hot-electrons and hot-holes can be injected into the oxide interface with the aid of the vertical field or with their K.E. energy alone. • Injected current density is • Where n(x,y) is the local electron concentration at (x,y) • pinj(x,y) is the spatial distribution of injection probability • pinj(x,y) depends on several events that provide the electron with a momentum directed towards the oxide interface and with a K.E. sufficient to overcome interface potential barrier.
Injection of hot carriers occurs mainly in a narrow injection zone at the drain end of the device where lateral field reaches maximum. • In log channel MOSFETs, the spatial extent of injection region and magnitude of electric fields near the drain are largely independent of the channel length, L. • For short channel devices, the heavier dopin or shallower junctions increase the electric fields in the drain region. Due to short channel effects the channel current entering the drain increases more rapidly than 1/L. • Thus, devices with smaller geometries will be more sensitive to hot-carrier related degradation. • Oxide degradation in the form of charge trapping which occurs in a short distance of about 0.1 m. However, a large percentage of the electrons entering the oxide are either scattered in the oxide and/or returned to Si substrate by the opposing field. • The charges that do not reach the gate electrode degrades the oxide by charge trapping and interface trap generation.
Impact Ionization by Hot-Electrons • In saturation region a high exists in the channel depletion region. Electrons will, therefore, be accelerated by the field. Some move horizontally and creates electron hole pairs (EHP) by impact ionization near the drain. • Impact ionization process creates an avalanche plasma consisting of generated EHP in the pinch-off region • The holes created are collected by the substrate constituting the drift component of the substrate current • The drain current that contributes to impact ionization substrate current is a function of lateral electric field in pinch off region and VGS and L
Some electrons and holes in the avalanche plasma can gain sufficient K.E. to surmount Si-SiO2 potential barrier and become injected into SiO2. Majority of the holes generated constitute substrate current of MOSFET. Therefore, substrate current is considered a reliable and convenient monitor of the amount of hot-carrier degradation in n-MOSFETs • To create EHP, hot-electrons must have K.E. > (impact ionization energy). Thus is the distance the electrons must travel in to gain energy i. • The probability of an electron travelling a distance to gain the required K.E. or more is where is hot-electron mean-free path. Since IDS is the total electron flow in the channel. Rate of supply of hot-electrons with K.E. > i is where C1 is a weak function of the max. channel field Em.
Oxide Traps and Charge Trapping • Concentration of oxide trapped charges and interface trapped charges are changed by capture of excess electrons or holes by existing traps in the oxide. • The oxide charge distribution can also be changed by impact release of the trapped electron or hole by a hot-carrier. The electron or hole traps in the gate oxide are mainly Si “dangling bonds”. The dangling bonds give rise to the electron and hole traps. Interface Trap Concentration • Interface trapped charge arises from a.) structural, oxidation-induced defects; b.) metal impurities; c.) defects caused by radiation or hot-carriers • Unlike other trapped charges, interface trapped charges are in electrical communication with the underlying Si. Thus, influence of interface trapped charge on electrical characteristics of MOSFETs depends on its bias conditions. • Generation of new interface trap is the primary cause of degradation of MOSFETs. New traps generated by hot-electrons and hot-holes through breaking:
Si-Si and Si-O bonds • breaking of H bonds at interface, releasing H and leaving dangling Si- or O- bonds • H released by hot-carrier impact migrates towards Si-SiO2 interface and is then trapped by proton traps. Bias Dependence of Degradation Mechanism • Oxide degradation takes place by carrier trapping in oxide due to hot-electron carrier injection and interface trap creation • These are the two most significant degradation mechanism, but there is no clear consensus on their relative contribution Hot-carrier related device degradation reaches maximum when VGS = VDS/2. This coincides with max. of substrate current, thus it is often linked to impact ionization. • When VTH shift is plotted as a function of gate voltage, the degradation exhibits 2 local maxima: • First peak: electron injection into SiO2 is max. resulting in charge trapping • Second peak: at VGS = VDS/2, corresponds to impact ionization of electrons and holes.
For VTH = VDS/2, VTH(t) = Atn where 0.5 < n < 0.7 • A depends on ISUB, IDS and processing parameters Effects of Hot-Carrier Damage on Device Characteristics • Trapped charges in gate oxide influence surface potential and thus local flat band voltage • C-V measurement can be used to measure total amount of trapped charge in SiO2. Accumulating negative charge shifts the local VFB to positive direction. • Influence of interface traps generated by hot-carriers depends on the instantaneous bias conditions. Since interface traps are in electrical communication with the underlying Si substrate, occupation of the traps depends on the Fermi level at the Si-SiO2 intface and energy distribution of interface traps and the physical nature of NiT (whether the trap is acceptor or donor type). • In n-MOS most generated NiT are acceptor type, mostly located at the drain end. Trapswill start to be charged by electrons from substrate as the surface is biased from accumulation into weak inversion, ant then into strong inversion
Once all traps are filled, their influence is similar to fixed oxide charge, which is the case because for all practical purposed the device are in strong inversion • Surface mobility is decreased due to increased surface scattering • Significant reduction in ID in linear region • Less effect on ID in saturation region because once in saturation ID is governed by the channel region between the source and pinch off point • Asymmetry between forward and reverse I-V curves also due to localization of oxide damage near the drain end • as n decreases gm decreases • ID/ID0 decreases • VT increases Radiation Induced Interface Traps • The major effect of ionization radiation on MOS devices is the generation of positive oxide charge resulting from hole-trapping at Si-SiO2 interface.