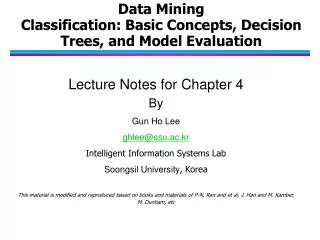
Lecture 2: Decision Trees
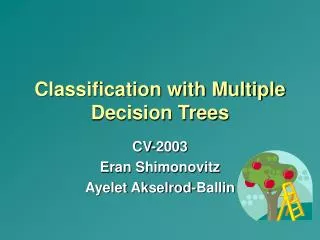
Lecture 2: Decision Trees. Machine Learning Queens College. Today. Decision Trees Entropy and Information Theory Information Gain “Purity” or “Classification Accuracy”. Decision Trees. Want a fast meal?. No. Yes. How about coffee?. On expense account?. Yes. No. Yes. No.

Lecture 2: Decision Trees
E N D
Presentation Transcript
Lecture 2: Decision Trees Machine Learning Queens College
Today • Decision Trees • Entropy and Information Theory • Information Gain • “Purity” or “Classification Accuracy”
Decision Trees Want a fast meal? No Yes How about coffee? On expense account? Yes No Yes No Starbucks McDonald’s 21 Club T.G.I. Friday’s • Trees that define a decision process • Internal nodes: questions associated with a specific feature • Leaves: Decisions
Decision Trees color green blue brown h w w <66 <150 <140 w w h h m f <66 <145 <64 <170 m m f m f f f m Very easy to evaluate. Nested if statements
More formal Definition of a Decision Tree A Tree data structure Each internal node corresponds to a feature Leaves are associated with target values. Nodes with nominal features have N children, where N is the number of nominal values Nodes with continuous features have two children for values less than and greater than or equal to a break point.
Training a Decision Tree How do you decide what feature to use? For continuous features how do you decide what break point to use? Goal: Optimize Classification Accuracy.
Baseline Classification Accuracy • Select the majority class. • Here 6/12 Male, 6/12 Female. • Baseline Accuracy: 50% • How good is each branch? • The improvement to classification accuracy
Training Example color green blue brown 2M / 2F 2M / 2F 2M / 2F 50% Accuracy before Branch 50% Accuracy after Branch 0% Accuracy Improvement Possible branches
Training Example height <68 5M / 1F 1M / 5F 50% Accuracy before Branch 83.3% Accuracy after Branch 33.3% Accuracy Improvement Possible branches
Training Example weight <165 5M 1M / 6F 50% Accuracy before Branch 91.7% Accuracy after Branch 41.7% Accuracy Improvement Possible branches
Training Example weight <165 5M height <68 5F 1M / 1F Recursively train child nodes.
Training Example weight <165 5M height <68 weight 5F <155 1M 1F Finished Tree
Generalization • What is the performance of the tree on the training data? • Is there any way we could get less than 100% accuracy? • What performance can we expect on unseen data?
Evaluation Evaluate performance on data that was not used in training. Isolate a subset of data points to be used for evaluation. Evaluate generalization performance.
Evaluation of our Decision Tree • What is the Training performance? • What is the Evaluation performance? • Never classify female over 165 • Never classify male under 165, and under 68. • The middle section is trickier. • What are some ways to make these similar?
Pruning weight weight <165 <165 5M 5M height height <68 <68 weight 5F 5F 1F / 1M <155 1M 1F There are many pruning techniques. A simple approach is to have a minimum membership size in each node.
Decision Trees • Training via Recursive Partitioning. • Simple, interpretable models. • Different node selection criteria can be used. • Information theory is a common choice. • Pruning techniques can be used to make the model more robust to unseen data.
Entropy and Information Theory • Entropy is a measure of how homogenous a data set is. • Also how even a probability distribution or a random variable is. • The unit of Entropy is the bit. • Under an Information Theory perspective entropy represents the fewest bits it would take on average to transmit information in a signal (i.e. a random variable)
Entropy • Say I have a vocabulary of 4 items. • A, B, C, D. • A standard encoding of these might be • 00, 01, 10, 11. • 2 bits per vocabulary item. • However, if A is much more common, it might be more efficient to use this coding • 0, 10, 111, 110 • Exercise: What is the average bit length if there are 150 As, 40 Bs, 5 Cs, and 5Ds?
Calculating Entropy Where pi is the probability of selecting the ith value. For example, say X = {A A A B B B B B} In the calculation of entropy 0 log 0 = 0
Information Gain • In our previous example we examined the improvement to classification performance. • Error reduction or change to overall accuracy. • Using entropy the measure that is optimized is Information Gain. • The difference in the entropy of the label or class distribution before or after a particular decision tree split.
Calculating Information Gain 3M / 1F make BMW VW Ford 1M / 0F 1M/ 0F 1M / 1F
Calculating Information Gain 3M / 1F make BMW VW Ford 1M / 0F 1M/ 0F 1M / 1F
Calculating Information Gain 3M / 1F make BMW VW Ford 1M / 0F 1M/ 0F 1M / 1F
Calculating Information Gain 3M / 1F Identify the feature with the greatest Information Gain and repeat this process recursively make BMW VW Ford 1M / 0F 1M/ 0F 1M / 1F
Next Time: Math Primer • Probability • Bayes Rule • Naïve Bayes Classification • Statistics • Normal Distribution • Multinomial Distribution • Read Chapter 8