Download

1 / 18
190 likes | 332 Views
Risk and Return – Introduction. For 9.220, Term 1, 2002/03 02_Lecture12.ppt Student Version. Outline. Introduction What is risk? An overview of market performance Measuring performance Return and risk measures Summary and Conclusions. Introduction.

E N D
Risk and Return – Introduction For 9.220, Term 1, 2002/03 02_Lecture12.ppt Student Version
Outline • Introduction • What is risk? • An overview of market performance • Measuring performance • Return and risk measures • Summary and Conclusions
Introduction • It is important to understand the relation between risk and return so we can determine appropriate risk-adjusted discount rates for our NPV analysis. • At least as important, the relation between risk and return is useful for investors (who buy securities), corporations (that sell securities to finance themselves), and for financial intermediaries (that invest, borrow, lend, and price securities on behalf of their clients).
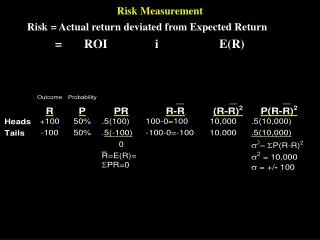
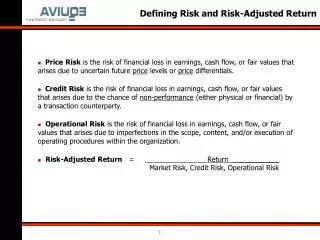
What is risk? • Definition: risk is the potential for divergence between the actual outcome and what is expected. • In finance, risk is usually related to whether expected cash flows will materialize, whether security prices will fluctuate unexpectedly, or whether returns will be as expected.
Measuring Performance: Returns • Dollar return (over one period): = Dividends + End of Period Price – Beginning of Period Price • Percentage return (over one period): =Dollar return/Beginning of Period Price =(Dividends + End of Period Price)/Beginning of Period Price -1 • Examples: calculate both $ and % returns • P0=$50, Div1=$2, P1=$55.50 • P0=$20, Div1=$0.25, P1=$12.75 • P0 = $30, Div1=$1, Capital Gain=$5 • P0 = $130, Div1=$0, Capital Loss=$128
Holding Period Returns • Let Rt be the observed return earned in year t, then the holding period return over a T-period time frame is as follows: • The average compound rate of return or geometric average rate of return (GAR) just converts the HPR to an equivalent effective annual rate:
Mean returns • The mean return is the arithmetic average rate of return and is calculated as follows:
The risk premium • Definition: the risk premium is the return on a risky security minus the return on a risk-free security (often T-bills are used as the risk-free security) • Another name for a security’s risk premium is the excess return of the risky security. • The market risk premium is the return on the market (as a whole) minus the risk-free rate of return. • We may talk about the past observed risk premium, the average risk premium, or the expected risk premium.
Risk Measures • Studies of stock returns indicate they are approximately normally distributed. Two statistics describe a normal distribution, the mean and the standard deviation (which is the square root of the variance). The standard deviation shows how spread out is the distribution. • For stock returns, a more spread out distribution means there is a higher probability of returns being farther away from the mean (or expected return). • For our estimate of the expected return, we can use the mean of returns from a sample of stock returns. • For our estimate of the risk, we can use the standard deviation or variance calculated from a sample of stock returns.
Sample standard deviation and variance • Sample variance is a measure of the squared deviations from the mean and is calculated as follows: • Sample standard deviation is just the square root of the sample variance:
How to interpret the standard deviation as a measure of risk • Given a normal distribution of stock returns … • there is about a 68.26% probability that the actual return will be within 1 standard deviation of the mean. • there is about a 95.44% probability that the actual return will be within 2 standard deviations of the mean. • There is about a 99.74% probability that the actual return will be within 3 standard deviations of the mean.
Summary and conclusions • We can easily calculate $, %, holding period, geometric average, and mean returns from a sample of returns data. • We can also do the same for a security’s risk premium. • The mean and standard deviation calculated from sample returns data are often used as estimates of expected returns and the risk measure for a security or for the market as a whole.