Download
1 / 17
170 likes | 350 Views
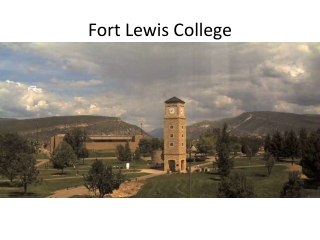
Fort Lewis College. 2006-07 Greenhouse Gas Inventory Presented by the Fort Lewis College Environmental Center January 31, 2008. The President’s Climate Commitment. President Bartel signed the ACUPCC on April 6, 2007 FLC is a charter signatory!! Short-term commitments:

E N D
Fort Lewis College 2006-07 Greenhouse Gas Inventory Presented by the Fort Lewis College Environmental Center January 31, 2008
The President’s Climate Commitment President Bartel signed the ACUPCC on April 6, 2007 FLC is a charter signatory!! Short-term commitments: Set up a committee to address climate change Complete a greenhouse gas inventory All new construction will be LEED-Silver or equivalent All new equipment will meet energy-efficient ratings such as Energy Star™ Long-term commitments Implement a plan to achieve a climate neutral campus
Methodology EC student Jackie Kuusinen ‘07 researched potential methodologies in Spring of 2007 FLC decides to use the Clean Air-Cool Planet calculator to evaluate emissions Conference call with CA-CP on how to use calculator in September 2007
The CA-CP Calculator Used by over 200 campuses and endorsed by Association for the Advancement of Sustainability in Higher Education. Conforms with Greenhouse Gas Protocols for carbon counting Converts emissions from all gases to metric tons of carbon dioxide based on their global warming potential
Understanding Emissions Scope 1 – Emissions from sources owned and operated by FLC (e.g. vehicles) Scope 2 – Emissions from imported sources of energy (e.g. purchased electricity) Scope 3 – Indirect sources generated by but not controlled by FLC (e.g. commuters)
Data Collection EC students collected data from Physical Plant staff in Fall of 2007 EC students collected 676 “How Do You Roll” commuter surveys from FLC students, faculty, and staff Consultants from the team of Woodard & Curran compiled data and analyzed commuter survey
Data Gaps Air Travel – We cannot calculate emissions from official travel using FLC’s current recordkeeping system Refrigerants – There were no records on emissions from refrigerants leaking into the atmosphere Vehicle Fleet – FLC’s recordkeeping system does not account for fuel purchased off-campus History – We have data on commuting, waste, vehicles only for FY 2006-07
Assumptions Commuting data factors in several assumptions about distances traveled Waste data is based on spot surveys of how full dumpster are rather than actual weights of trash Vehicle fleet data assumes 90% of fuel comes from on-campus gas station
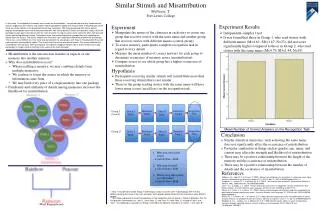
Results Total emissions for FY2006-07 were the equivalent of 15,329 metric tons of carbon dioxide That’s 4.11 metric tons per student or 3.55 metric tons per FLC community member
Sources • 76% of emissions come from heating and electricity • Incidental sources equal to less than 1%: • Fertilizer applications • Animal waste
Commuting Habits Drive alone: 39% students, 64% fac/staff Carpool: 49% students, 22% fac/staff Durango T: 18% students, 13% fac/staff RT average for students who drive: 15.2 miles RT average for fac/staff who drive: 20.4 miles
Breakdown FLC produces the equivalent of 14.2 kg of CO2 per square foot of building space FLC’s vehicle fleet generated the equivalent of 3,016 metric tons of CO2 FLC produced 624 tons of solid waste in FY2006-07 that accounted for the equivalent of 618 metric tons of CO2
How do we compare? S. Oregon – 1.06 metric tons/student Portland State – 1.65 metric tons/student Evergreen St. – 5.11 metric tons/student NAU – 6.83 metric tons/student CSU – 7.35 metric tons/student UC-Berkeley – 4.35 metric tons/person UNC-Asheville – 7.8 kg/square ft. Fort Lewis College 15,329 metric tons of eCO2 4.11 metric tons/student 3.55 metric tons/person 14.2 kg/square foot Note: Different schools’ inventories vary by scope and thoroughness. For example, FLC did not include air travel, while UC-Berkeley did. Southern Oregon did not include any emissions from commuting or travel. Additionally, different schools count student enrollment in different ways.
Offsets In 2006-07, FLC offset the equivalent of 1 metric ton of CO2 by composting 4.7 tons of food waste If every person at FLC contributed $2 per semester, FLC could reduce its GHG emissions by 10%.
How do we get to zero? Conserve energy – learn to live with buildings that are a little warmer or cooler than normal Invest in energy efficiency with new equipment, better insulation Construct high-performance buildings – the new Student Union will likely be 30-50% more efficient than regular buildings Produce renewable energy on campus, especially solar and solar hot water
How can I help? Carpool, take the T, bike or walk to campus Turn off lights, appliances, and chargers Reduce, reuse, recycle, and compost Support the FLC green fee - a $2 per semester per person fee for clean energy and other sustainability projects at FLC
Want more information? Contact the Fort Lewis College Environmental Center at 247-7676 or visit http://envcenter.fortlewis.edu Our Climate Action Team meets every week during the school year