Download
1 / 8
80 likes | 265 Views
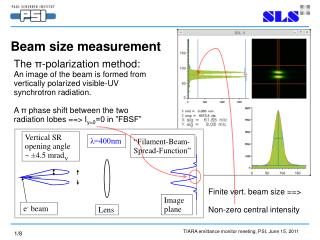
Vertical SR opening angle ~ ±4.5 mrad V. λ=400nm. “Filament-Beam-Spread-Function”. Image plane. e - beam. Lens. Beam size measurement. The π -polarization method : An image of the beam is formed from vertically polarized visible-UV synchrotron radiation.

E N D
Vertical SR opening angle ~ ±4.5 mradV λ=400nm “Filament-Beam-Spread-Function” Image plane e- beam Lens Beam size measurement The π-polarization method: An image of the beam is formed from vertically polarized visible-UV synchrotron radiation. A π phase shift between the two radiation lobes ==> Iy=0=0 in ”FBSF” Finite vert. beam size ==> Non-zero central intensity
Beam size measurement: alternative/complement The interference method (Mitsuhashi):
Beam size measurement: beamline components CRUCIAL! the ”finger” absorber
Beam size measurement: precision Vertical: Predicted profiles (SRW*) for beam height values 0, 6.4, 9.0µm, and measured. Statistical rms error = 0.1µm Horizontal: Predicted profiles (SRW) for beam width values 54, 57, 60µm, and measured. Statistical rms error = 0.3µm *) Synchrotron Radiation Workshop, see EPAC’98 Chubar, Ellaume
Beam size measurement: systematic errors • The smallest rms beam height values so far measured at SLS are around 5 µm. In this region it is difficult to exclude systematic error contributions to the measured value from various non-perfect optical elements. The valley-to peak ratio is only ~ 5 %, and this number we should consider as a lower limit.
Principles for a new monitor • For a rms beam height of 3 µm, we can keep the valley-to-peak ratio to 6% with the same type of experimental set-up (transmission optics). The only difference is to use 200 nm SR instead of the present 365 nm. Fused Silica is transmitting well enough; a custom made interference filter might be needed (230 nm filters are available); a Glan-Taylor polarizer should still do (Calcite). • We should consider going to a reflective focussing mirror instead of a lens. This should ease the requirements on the interference filter. It could also allow for even shorter wavelengths, but then the CCD has to go into vacuum; filters and polarizer still to be found. • A central absorber with larger heigth can be introduced allows a cross-check with the interference method (Mitsuhashi).
Possible improvements on exciting monitor: • Exit window should be made of a λ/20 optical flat piece. Tests OK at MAX-lab. • The exit window can be cleaned in situ if a valve is introduced in front. It is a possible method for mirror cleaning (removing Carbon), to leak in oxygen and expose it to UV-radiation. We should be able to do likewise. • The lens can be made with better surface accuracy, λ/20, than the present. It should also have a longer focal length. • A central absorber with larger heigth can be introduced allows a cross-check with the interference method (Mitsuhashi).
Outlook, MAX-IV 3 GeV ring: π-polariz. metod E = 3 GeV C = 528 m I = 500mA ex = 250 pmrad ey = 1 pmrad βy = 14 m ==> σy=3.7μm OK! βx = 1.8 m ==> σx=21μm Large hor. acc. angle ==> OK! Light source MAX IV Observe