Download

1 / 24
240 likes | 497 Views
The Niagara Border – 10 Years After 9/11. BETA Presentation November 2011. Study overview.

E N D
The Niagara Border – 10 Years After 9/11 BETA Presentation November 2011
Study overview • Deloitte & Touche LLP (“Deloitte”) was retained by the Binational Economic & Tourism Alliance (“BETA”) in 2010 to assist in its strategic study of the impact of changes to the Niagara border on the flow of economic activity between the United States and Canada • BETA had completed two previous studies: - internal survey of members in July of 2009 to determine impacts of WHTI on their businesses - commissioned survey of 400 WNY/400 Niagara Residents regarding their cross-border travel behaviour and reasons for same • First time study specifically focusing on the Niagara border crossing Binational Economic and Tourism Alliance
Approach & Methodology • Study elements included: • A literature review of economic impact studies of Canada – U.S. border crossing challenges, with a focus on key findings • Stakeholder consultation, which was comprised of approximately 30 interviews with industry participants to collect input regarding border challenges; stakeholders include BETA’s project partners, key identified groups or businesses, and key government agencies • Deloitte undertook four small case studies, which focused on a various cross border activities: cross border education, trucking and transportation, the World Junior Hockey Tournament and the bus industry
A Brief History of Key World & Economic Events 1994 – NAFTA Agreement 1995 – Oklahoma City Bombing; U.S./China Trade Agreements 1996 – TWA Flight 800 – Terrorism Hits Home; Casino Niagara Opens 1999 – 2001 – Japanese Dot.Com Crash 2000 – 2002 – North American Dot.Com Crash 2001 – Sept. 11 World Trade Towers; U.S. War on Terrorism 2002 – Insurance Industry Changes; Airline Industry Restructuring 2003 – SARS, Mad Cow, West Nile; Eastern Seaboard Snowstorms & California Wildfires; Seneca Niagara Casino Opens 2004 – Cold Weather, Hurricanes, Indian Ocean Tsunami; Niagara Falls Casino Resort Opens 2005 – Blizzards; WHTI Announcement; Hurricane Katrina 2006 – Summer Heat Wave & Power Outages; October Ice Storm 2007 – WHTI – Phase One: Air; Crippling Winter Storms, Crop Losses 2008 – Gasoline Prices Peak; U.S. Housing Market Crash; North American Auto Bailout 2009 – U.K. Recession; GM & Chrysler Bankruptcy Filings; Swine Flu; WHTI – Phase Two: Land & Marine; U.S. Poverty Rate hits 14.3% (highest since 1994) 2010 – Chile Earthquake; BP Oil Spill Gulf of Mexico; Iceland Volcano; Canadian/U.S. Dollar Parity 2011 – European Union Financial Crises; Japanese Earthquake & Tsunami
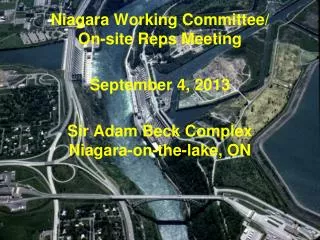
Study overview The focus of this study was the four bridge crossings which comprise the Port of “Buffalo – Niagara”. The bridge crossings are: Lewiston-Queenston Whirlpool (a Nexus only crossing) Rainbow Bridge Peace Bridge Binational Economic and Tourism Alliance
Buffalo Niagara – the Busiest Northern Border Crossing The Buffalo Niagara crossings consistently ranks as the top passenger crossings along the US and Canada border. The bridges rank second to the Windsor Detroit crossing for truck trade. Binational Economic and Tourism Alliance
The Niagara Crossings – A critical trade link • Total trade had increased at the crossings from 2002 until 2008 reaching a peak of approximately $80 billion in combined imports and exports. • The decrease in 2009 was related to the economic downturn which saw US GDP drop by almost 3%. Binational Economic and Tourism Alliance
Trade – More than just a NY state issue • 15% of all trade between NY State and Canada crosses the Buffalo Niagara Bridges and 14% of Pennsylvania Trade. Binational Economic and Tourism Alliance
Truck traffic • Though trade have seen total dollar values rise, truck crossings have shown a decline starting in 2004. Preliminary information for 2010 and 2011 are showing a reversal of this trend. • Some of the decrease can be explained by changes in the US economy however it is not fully correlated to US GDP. Binational Economic and Tourism Alliance
The decline of local passenger vehicle traffic The following chart outlines by “travel zone” the nature of the trips undertaken during the two survey periods. The zones are categorized as follows: Internal Zone– relates to the bordering regions of the Niagara bridges. Thus on the New York state side the internal zone was made up of Niagara and Erie counties, while the Canadian zone related to the Niagara region. External Zone – relates to areas outside of the bordering regions of the bridge. The trip categories in the survey were as follows: Internal zone to internal zone – this would represent a local trip Internal zone to external zone – this would represent an intermediate length trip External zone to internal zone – this would represent an intermediate length trip External zone to external zone – this would represent an long distance trip Binational Economic and Tourism Alliance
Planned vs. discretionary travel • US same day travel showing significant decreases, while overnight is more stable • Canadian shows growth for same day travel and overnight travel since 2003 • This shows a dichotomy of travel patterns between US and Canadian same day traveler • Key influencers – exchange rates, new demand generators (Casinos), lack of marketing focus from some in the tourism industry. Proportion of Same-day and Overnight Travel for all Buffalo-Niagara Crossings Binational Economic and Tourism Alliance
Further insight – BETA survey Marketing Decisions Group Survey results May 2010 Report Undertaken post July 1st 2009 – full WHTI adoption. 53% had appropriate ID but were still not traveling, 9% were waiting for ID. Binational Economic and Tourism Alliance
5 Key Issues Identified in Deloitte Interviews Adequacy of the physical and technological infrastructure at the border crossing. Border crossing/wait times. Service execution by Border Agencies & Bridge Commissions. Economic impact of process changes at border crossings. Inconsistency/lack-of communications/public knowledge regarding border crossing requirements.
Case Study #1 – 2011 World Junior Hockey Tournament Advance Planning & Communications: • Border task force created where stakeholders from all sectors could effectively work together and harmonize approaches to challenges • Advanced, increased and consistent communication to both internal partners and broader public • Bus passenger roster protocol – manifest and on-bus scan pilot • Traffic management and full staffing on peak days • 115 minute wait into the U.S. between 2 and 4 p.m. on December 28 (Canadian Boxing Day, Buffalo Bills Game mid-day, 4 World Junior Games to Kick off Tournament – 65% Canadian audience) • 335,000 attended all games over 11 days of tournament, bringing family; $20 million + economic impact and friends who shopped, toured, dined in WNY and Niagara, ON • No complaints or significant incidents to report at the border “BUFFALO, N.Y. – The curtain has officially closed on the 2011 International Ice Hockey Federation World Junior Championship, the most successful and most attended event ever hosted by USA Hockey.The 11-day tournament, staged Dec. 26-Jan. 5 at HSBC Arena in Buffalo, N.Y., and Dwyer Arena in Lewiston, N.Y., drew 331,297 fans for the 31 total games (10,687 average per game). The total attendance is second in World Junior Championship history only to the 453,282 that attended the tournament in Ottawa. “
Case Study #2 – Cross Border Motor Coach Activity Need for Better Processes, Consistent Application • Motor coaches carry approx 860 million passengers pr year in Canada and U.S. (774 million U.S., 86 million Cdn) • 2008, 1.3 million trips to U.S., 12.5 million overnight and 10.2 million same day trips to Canada – 1.1 million jobs in U.S. paying $40.6 billion in wages • Each bus generates between $7,000 and $13,000 per day in economic activity to communities visited (accommodation, meals, entertainment) • Bus travel efficiency/effectiveness measured by how fast border crossing is completed (approach, cross, process, release) • Opportunities – pre-clearing, manifests, on-board processing • Challenges – no current mandatory processes, number of companies involved, scheduling to avoid border congestion times, passengers • MCC/OMCA already involved in discussions with CBSA & CBP to improve processes
Case Study #3 – Canadian Border Commuter Students Improved Communications, Processes & Specialist Development • Niagara University, UB, Medaille College & D’Youville cater to specific training needs of Canadian students • Efficient border crossing for students critical for class and exam attendance • Average student spends approx $22,000 to $32,000 annually for study programs ($12,000 - $17,000 tuition; $10,000 - $15,000 visa, books, food, vehicle, occasional accommodation) ; D’Youville $19.2 million • Challenges – Student F-1 Visa requirements and DHS reporting every term – costs, timing (August & January), time involved, operational risk to college (can have international student operations shut down) • Solutions – International Student Offices/Specialists, advanced information and outreach sessions, NEXUS promotion, increased coordination between border services and schools to improve processes
Case Study #4 – Freight & Transportation Trade Significance, Unpredictable Wait Times, Documentation, Training, Costs to do Business • Niagara border poses specific challenges for U.S. & Cdn freight carriers • U.S. activity comprises significant portion of business for Niagara operators • Unpredictable wait times & process inconsistencies pose risk to customer base, added fuel and staffing costs • Increased need for documentation = increased need for training and staff specialists • Scheduling challenges with ACE – advanced cargo reporting; results in lost productivity and utilization, as well as potential fines and impoundment • Trusted commercial travel program challenges – C-TPAT must enroll carrier and all parties involved – supplier and customer • Niagara also has higher volume of “Less Than Full Loads” which impacts process
Case Study #4 – Freight & Transportation (Continued) Trade Significance, Unpredictable Wait Times, Documentation, Training, Costs to do Business • Border crossing inefficiencies costing $290 million to Canadian trucking industry and $9 billion to U.S. trucking industry (North and South borders, 2007 Transport Canada Study) • Increases in costs/time directly passed on to customers; Canadian trucking companies indicated range of 18% to 27% • In 2009, total U.S. GDP associated with commercial truck transport as $113 billion; average annual freight totals 1.3 million ton-miles (U.S. Research & Innovative Technology Administration) • Many carriers have adjusted their daily operations to a 24 hour clock in order to reduce delay times • Continuation of E-manifest and compliance to documentation requirements • Increased infrastructure improvements at Peace Bridge & Queenston-Lewiston – more clearance capacity, separation of truck traffic, traffic management • Security needs recognized and understood, but industry asking for standard and consistent procedures across all border crossing points
Key Recommendations & Implementation Steps The Study Findings Focused on Four Specific Areas for Improvements: • Communications • Infrastructure • Process • Policy Recommendations and lead organizations have been broken down according to these categories. No one organization is responsible for improvements at the border – all border community stakeholders and travelers are part of the solution. PREPARED TRAVELER + RIGHT I.D. = FASTEST CROSSING Binational Economic and Tourism Alliance
Communication Recommendations • Improve signage with travel/crossing times for each bridge – reduce “negative message” ie border crossing vs wait times, year-round messaging - MTO, DOT, NITTEC • Install better way-finding signage in key areas - Emergency Detour Routes in Ontario, improvements around Rainbo Bridge, additional alternate signage messaging at high volume consumer sites (arenas, shopping) – MTO, DOT, NITTEC, Bridges, Business, Tourism, Retail and Entertainment Locations • Incentivize targeted travel behaviour - 24 hour travel clock; NEXUS and other trusted travel programs; “away from the border benefits” retail, entertainment – Bridges, Business, Tourism, Retail and Entertainment Locations • Create a permanent multi-stakeholder group to deal with ongoing communications - NITTEC Border Crossing Committee in place; adding BETA, EDICA & Niagara Region to the group to incorporate business and tourism communications • Better communication to travelers; make aware of existing and new service standards - early, comprehensive and consistent marketing and one message communicated by all stakeholders – CBSA, CBP, Bridges, Business, Tourism, Retail & Entertainment 6) Continue monitoring and reporting service levels and communications against these standards – multi-stakeholder group 7) Make the traveler accountable as part of this process - counteract “CNN” factor; trusted traveler program users growing and will see additional benefits of usage
Infrastructure Recommendations • Undertake strategies to maximize the physical spaces at the border crossings - Canadian versus U.S. holding areas - processing activities in secured areas - sovereignty issues need to be overcome - steps already underway and much progress made over past ten years with more to come under joint federal initiative 2) Develop joint infrastructure initiatives to better align services and customer experiences - U.S. technology improvements vs Cdn built infrastructure - different responsibilities – Security vs Customs - different processes – exemptions, duties, documentation, tenancies • Continue expanding new technology infrastructure to support efficiencies - handheld scanners, trusted travel programs, pre-clearances Responsibility lies with CBP, CBSA, with input from bridges, business, tourism, retail, community
Process & Policy Recommendations • Optimize available resources during peak times • Better bridge traffic management • Infrastructure & technology • Joint strategies & implementations • Performance measurement & reporting Responsibility of CBP, CBSA, Bridge Commissions, Business, Tourism, Retail, Community to work together towards new solutions.
Summary Our borders have changed permanently. Global economy is a reality – North America and especially cross-border regions like GTA/Hamilton/Niagara/Western New York must develop innovative regional methods to maintain our competitiveness. The Niagara border crossing is a critical lifeline to the North American economy – need to work from current realities, eliminate myths, and involve business, community, government and travelers in solutions. Next steps – what this means for and to your business and how you can help. Q & A
Contact Details For Additional Information or To Get Involved: Arlene White, Executive Director Binational Economic & Tourism Alliance U.S. - 143 Genesee St., Buffalo, NY 14203 Tel 716.856.6525 ext 133 TF 1.877.884.2736 Fax 716.856.6754 Canada – 5400 Robinson St., 2nd Floor, Niagara Falls, ON L2G 2A6 Tel 905.401.4450 arlene.white@btapartners.com www.btapartners.com and www.btaglobalgateway.com